Apple Inc. (NASDAQ: AAPL) is the
World's Number One Innovative Company, three years in a row according to BusinessWeek's 2007 list of the world's 50 most innovative companies. BusinessWeek proclaims "their creativity goes beyond products to rewiring themselves." BusinessWeek ranks the innovative companies based on the responses received from over 1,000 global executives of the largest global corporations; survey questions include innovation metrics on process, product and business model innovations.
Apple is one of the Top 20 Innovators of
The Innovation Index.
According to BusinessWeek, innovation today is “much more than new products.” Innovation is also “reinventing business processes and building entirely new markets that meet untapped customer needs.” The ubiquity of the Internet and globalization of the business expand generation of new ideas. Innovation is then “selecting and executing the right ideas and bringing them to market in record time.”
iPod driving Apple to Number One Innovative Company
iPod, powered by Apple, introduced in 2001 and masterminded by Steve Jobs, combines outstanding design, easy-to-use interface, superb performance, and an experience like no other. Apple assumed the world’s number one innovative company position and held it again in 2006 in large part due to the exponential growth of iPod – aptly called the iPod phenomenon. Just ask the tens of millions of fans walking, driving, jogging, exercising, chatting, playing, humming, relaxing, singing, rocking, screaming, and above all enjoying their daily iPod experience. Imagine if they were to miss their iPod for a day, or even for a few hours. iPod is oxygen – pure and simple – the source of life for these millions of fans. Not to mention iPod has become associated with personal status and symbol that speaks of cool, hip, polished, and different. What began as a new product quickly became a revolution. iPod is by far the best commercial innovation the world has seen in the last few years, and perhaps is the best innovation from Apple dating back through its storied history of innovation firsts. Apple one-upped the iPod design innovation by creating new innovations in business model with the launch of iTunes online service enabled by strategic partnerships with the Music, TV and Movie industry.
A Glorious History of Innovations
Apple has created great innovations
beginning with the first Apple computer in 1976

, Graphical User Interface (GUI) along with the popular Macintosh introduced in 1984,
the reliable PowerBook introduced in 1991, the PDA named Newton that created a new industry of handhelds in 1993, the new millennium revolution beginning with the iMac in 1998, the new iBook hot on the heels of the iMac in 1999, the iPod that put an oomph in the MP3 players and essentially changed music as we know it in 2001, iTunes software and Music store service that changed the Music industry business model and made it easy for fans to listen and buy music piecemealed in 2003, iPod mini, iPod (U2 Special Edition) and iPod photo in 2004, iPod shuffle, iPod nano, iPod with Video and Mac Mini in 2005, the new iMac with Intel core Duo processors and the new MacBook with Intel processors in 2006.
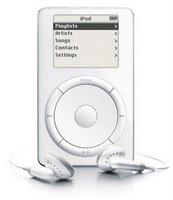
Five years of iPod Innovations2006 marks five years of iPod innovations. Apple's Hardware engineering chief
Jon Rubinstein assembled a team of engineers to design and build the first iPod in less than a year, and it was unveiled by CEO Steve Jobs on October 23, 2001 as a Mac-compatible product with a 5GB hard drive that put "1,000 songs in your pocket." Since then, Apple has introduced fourteen different models of iPods in various colors, displaying photos, downloading and playing videos, branded and signed by U2,
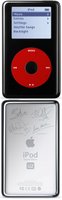
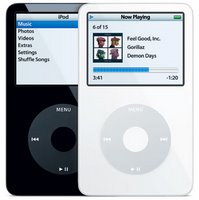
with numerous forms and shapes, different capacities for holding songs, pictures and videos, with connectors, next generation models with better wheels, and more. For instance, the new iPod video introduced in 2005 was the first iPod that could download and playback full-motion video with a larger color screen and better display resolution – an innovative package under $300 for the base model. Or the innovation in the wheel that is akin to the driving wheel on a car – from an original mechanical scroll wheel to the current touch-sensitive click wheel. According to PC Magazine, “In the years since (2001), the iPod's market share has grown tremendously, iPods have shrunk in size, Apple's iTunes Music Store has taken the lion's share of legal digital music downloads, and the iPod accessory market has exploded and taken on a life of its own.
All this has made the iPod as synonymous with "MP3 player" as Kleenex is with facial tissues.”
The love for iPodWhy do people love iPod perhaps more than their spouse, boyfriend, girlfriend or children? It has to do with the simple yet elegant design that makes it extremely easy-to-use (Toyota’s Innovation Factory), exceptional sound, video and imagery, and the amazing experience. The flexibility provided by the iTunes software and service that allows you to try and download any music and video with the click of a button from any computer or the Internet to your iPod. And all the available accessories from wireless headsets, remote controls, beautiful skins, acoustic speakers, to connectors that can literally take your iPod music and videos anywhere – inside the room, in the car, in the office, on the plane, even while taking shower. iPod fans can’t live without their iPods literally. And the search is still on for a music fan that has switched from an iPod to another MP3 player. And there is that small sharing thing: hard-core iPod fans don’t like to share their iPods with others.
BYOiPod. Bring your own iPod.
iPod’s ToplineIn the quarter ending September 2006, Apple sold 8.7 million new iPods, generating $1.5 Billion in sales, a third of Apple’s total quarterly sales. By the end of 2006, there will be over 67 million iPods in the world; Apple is poised to eclipse the 100 million iPods mark in 2007. iPod has revived Apple from the depths in 2001 when annual sales had plummeted to $5.36 Billion and Apple was losing money. Apple’s shares were under $10. Compare this to 2005, when Apple had sales of $13.9 Billion, and profits of over $1 Billion. Apple’s shares have climbed sixteen folds. The Apple machine is kicking into high gear, in large part due to iPod Innovation Revolution. iPod’s halo effect is even evident in the latest quarter when Apple sold more Macs than it has ever sold before: 1.61 million.
In 2007, Apple sold 52.7 million iPods, an increase of over 15% from the 45 million iPods sold in 2006. In the latest quarter ending December 2007, Apple sold 22.1 million iPods representing five percent unit growth and 17 percent revenue growth over the year-ago quarter. Can Apple grow iPods sales to over 20% in 2008? What strategy would Apple employ to lure more iPods buyers in 2008?
The next generation iPodsWhat innovations can be expected from iPod? Can Apple create jazzier, easier, feature-rich iPods?
How about iPods that beam songs and videos to each other, to a computer or even to a TV? Or iPods that deliver Presentations and Live Videos in team meetings. iPods with GPS Navigation system. iPods that combine as cell phones. iPods that can receive satellite radios. What innovations will Apple bring out next? Steve Jobs indicated in the latest quarterly earnings press release that 2007 will be an exciting year full of great new products. The world will be watching.
2008 Fast Forward 
Apple Inc. added new models of iPod(R) touch after the success of iPod touch launched in 2007. The new models have "double the memory, doubling the amount of music, photos and videos that customers can carry with them wherever they go."
iPod touch now comes in a 32GB model for $499 or less, joining the 16GB model for $399 or less, and the 8GB model for $299 or less.
iPod touch features Apple's revolutionary Multi-Touch(TM) user interface and pioneering software that allows users to find and enjoy all their music, videos, photos and more with just a touch of their finger. iPod touch models include the ability to automatically find your location using the new Maps application*; create Web Clips for your favorite websites; customize your home screen and watch movies from the new iTunes(R) Movie Rentals. iPod touch features the world's most advanced mobile web browser in the world with Safari(TM) and great mobile applications including Mail, Maps, Stocks, Weather and Notes.
Apple had an outstanding 2007 - the stock price and market cap more than doubled and finished upwards of 130% owing to such game changing innovations including the
new iPhone, the new
iPod Touch, and the all new Mac OS – Leopard, and on the strengths of the growing iPod and Mac business.
Retail research firm NPD Group says Apple's iPods still maintain a lock on the top spot in
U.S. sales of digital music and media players, with as much as 75% of the market.
Nike + iPod
One innovation that Apple created with another Top 20 Innovator of
The Innovation Index, NIKE, Inc. (NYSE: NKE) is Nike Plus. Apple calls it the "ultimate synthesis of sport and music: a pair of Nike+ shoes, an iPod nano, and the Nike + iPod Sport Kit."
Nike+ shoes feature a built-in pocket under the insole specially engineered for the Nike + iPod sensor. iPod nano syncs a runner's complete workout data with both iTunes and nikeplus.com. The Nike + iPod Sport Kit allows an athlete's Nike+ shoe to talk to the iPod nano. The sensor uses a sensitive accelerometer to measure the activity, then wirelessly transfers this data to the receiver on your iPod nano.
Nike + iPod receiver fits securely into the Dock connector on the bottom of the iPod nano. Wirelessly connected to the sensor in your Nike+ shoe, it receives up-to-the-second information as you run.
As one runs, iPod nano tells you your time, distance, pace, and calories burned via voice feedback that adjusts music volume as it plays. In addition to progress reports, voice feedback congratulates you when you’ve reached a personal best — your fastest pace, longest distance and time, or most calories burned. Besides the voice feedback, iPod nano plays the workout songs you choose, or have the iPod nano choose it for you based on your workout. You can also choose to play
PowerSong.
Nike+ has created a growing new business for Nike, and
Nike even touts this in their earnings reports and press. Is Apple planning to make more deals with more athletic companies besides Nike for the iPod? We will find out in 2008.
How can Apple turnaround the iPod sales growth?
Apple iPod - Apple's Best Innovation.
Creativity And Innovation in Business Definitive Guide is a 212-page collection of my handpicked 56 Creativity and Innovation best practices, case studies, articles, interviews, and insights on the current state of innovation in business. The eBook provides real-world examples on how the Top Innovators including
Apple, Google, GE, Proctor and Gamble, Yahoo, Toyota, Netflix, BMW, Deloitte, Timex, Frito Lays, Johnson & Johnson and more innovate and grow their business successfully time and again, especially during trying times. Use this eBook as a guide to find and create game-changing innovations, unblock creativity, and make innovation successful at your business. This eBook is used by over 300 leading organizations and universities including Pepsi, EDS, HP, Nokia and more.
Download the Creativity And Innovation in Business eBook NowSelected references:Leading eBook on Creativity and Innovation in BusinessCreativity and Innovation Best PracticesCreativity and Innovation Case StudiesThe Innovation IndexTop 50 innovative companies in the world
References:BusinessWeekPC MagazineApple-history.comApple.comWikipediaIntroducing The Innovation Index Fund - Learn about The Innovation Index
Top 50 Innovative Companies in the world - 2007 Report on Top 50 Companies
Annual Report - Chapter One - Total Innovation Activity - 2006 Annual Report One
Annual Report - Chapter Two - The Top Innovator - 2006 Annual Report Two
Annual Report - Chapter Three - The Innovation Insights - 2006 Annual Report Insights
Innovation and Stock Performance Correlation - The Innovation Index and Stock Performance
The Innovation Index gallops to 56% - Quarterly Report - Q3, 2007
About The Innovation Index
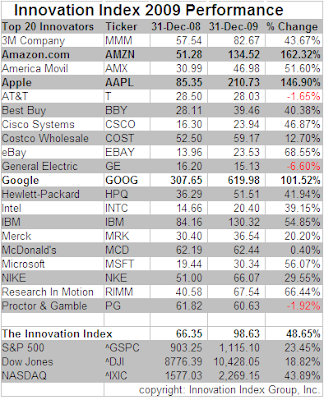
The Innovation Index introduced in December 2006 is a weighted stock price index of the top 20 Innovators in North America.
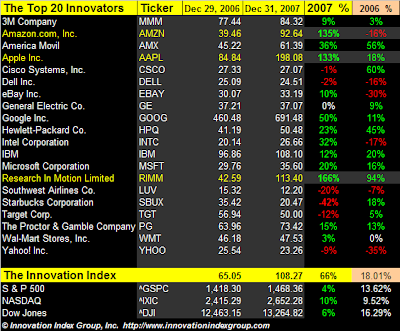
The Innovation Index returned 66% in 2007, and returned 174% over the previous five years (2002-2006). This assumes equal investment in each stock of The Innovation Index as of December 31, 2001. An average of $100 invested in The Innovation Index on December 31, 2001 returned $454 as of December 31, 2007. By comparison, $100 invested in S & P 500 returned 28% or $129, $100 invested in NASDAQ returned 34% or $136, and $100 invested in the Dow Jones Index returned 30% or $131 through December 31, 2007. The Innovation Index beats the S & P 500, NASDAQ and Dow Jones Index by more than seven times over the past six years.
Alphabetical list of the Top 20 Innovators of The Innovation Index for 2008 and their stock ticker symbols:
3M Company - (NYSE: MMM)
Amazon.com, Inc. - (NASDAQ: AMZN)
America Movil - (NYSE: AMX)
Apple Inc. - (NASDAQ: AAPL)
AT&T Inc. - (NYSE: T)
Best Buy Co., Inc. - (NYSE: BBY)
Cisco Systems, Inc. - (NASDAQ: CSCO)
Costco Wholesale Corporation - (NASDAQ: COST)
eBay Inc. - (NASDAQ: EBAY)
General Electric Co. - (NYSE: GE)
Google Inc. - (NASDAQ: GOOG)
Hewlett-Packard Co. - (NYSE: HPQ)
Intel Corporation - (NYSE: INTC)
International Business Machines Corp. - (NYSE: IBM)
Merck & Co., Inc. - (NYSE: MRK)
McDonald's Corporation (NYSE: MCD)
Microsoft Corporation - (NASDAQ: MSFT)
NIKE, Inc. - (NYSE: NKE)
Research In Motion Limited - (NASDAQ: RIMM)
The Proctor & Gamble Company - (NYSE: PG)
The Innovation Index will analyze the positions and standings of the Top 20 Innovators at the end of each year. For 2008, there will be no further changes in The Innovation Index.
Disclaimer: The Innovation Index Group, Inc. invests in the stocks comprising The Innovation Index.
Apple iPod innovation article originally published October 23, 2006. Updated February 09, 2008, May 08, 2009


