Showing posts with label ETFs. Show all posts

Thursday, November 6, 2008

Proctor and Gamble - P&G Innovating and Growing Strong in a Tough Economy

Did you know that Proctor and Gamble - P&G makes all these cool products below that you use everyday in your house?

You betcha... from Duracell and Gillette to Crest, Charmin to Tide, Bounty to Iams - P&G is the world's largest consumer goods company. As a matter of fact, "three billion times a day, P&G brands touch the lives of people around the world." P&G has a bigger mission that they are trying to fulfill: "Provide branded products and services of superior quality and value that improve the lives of the world's consumers, now and for generations to come."

P&G is one of the Top 20 innovators of the Innovation Index.

P&G stock is doing relatively well compared to its peers and the major indexes. Here is a snapshot of how well P&G is holding up - only down a few percentage points in 1 year, whereas the markets are down more than 30 points:

Why is P&G doing so well?

One answer: Innovation. Innovation driving new business, innovation driving growth, innovative leadership by the CEO of P&G A.G. Lafley. Back in February 2008, I had talked about how P&G is a Smart Long Term Buy in a Turbulent Market. IIG has stayed long with P&G througout the year, and has been opportunistically adding positions in P&G as well. Another fact that most investors may not know about: Barclays Global Investors and Berkshire Hathaway (Warren Buffett's company) are the top two institutional holders of P&G.

How did P&G do in the latest quarter?

P&G announced net sales growth of nine percent for the July - September quarter to $22.0 billion. Organic sales were up five percent, delivering at the mid-point of the Company's four to six percent target range. Sales growth was led by strong growth in the Beauty, Fabric Care & Home Care and Baby Care & Family Care segments. Diluted net earnings per share increased 12 percent to $1.03 for the quarter.

"This quarter was yet another example of the strength of P&G's balanced brand and geographic portfolio," said Chairman of the Board and Chief Executive Officer A.G. Lafley. "We continue focusing on leading innovation and improving productivity to deliver superior consumer and shareholder value. This focus on delighting consumers with trusted household and personal care products that consumers purchase weekly and use daily gives me continuing confidence P&G will deliver target growth over the long term, even in a challenging economic environment."

What is sexy, new and exciting that P&G is innovating?

P&G recently introduced Cascade Complete All-in-1 ActionPacs.

Cascade Complete All-in-1 ActionPacs "give you the confidence of a job done right. It breaks down, dissolves, and rinses away tough food particles without the need to pre-wash."

Here is what one highly satisfied P&G customer had to say about All-in-1 ActionPacs:

OMG this is the most amazing product

"I have an older dishwasher that came with the apartment I live in. You had to completely wash the dishes before putting them in the dishwasher. I was basically using it to drain the dishes. I saw this on T.V. and went to walmart and got it. All I can say is it is almost magical the way it cleans. I tested it on several hard to wash dishes, dried oatmeal, dried rice krispy cereal and my stainless steel pots and everything came out clean, no stuck on food, no hard water residue. thank you! thank you! thank you! what a time saver. I am disabled and one of the hardest things to do is standing over the sink washing dishes."
By beadjeannie. Reviewer from Fresno, CA August 14, 2008

Bottomline:

P&G is a great company with great leadership and employees, and highly satisfied customers. P&G will be around for the next 100 years. IIG - Innovation Index Group is long on P&G, and believes that P&G provides attractive buying opportunity at current price points. We believe that P&G will continue to grow another 10% to 15% even in this economy because of the breadth of its products, creativity and innovation, global marketshare, and delighted customers who will not buy another brand.

Innovation Index Reports

Introducing The Innovation Index
Annual Report 2007 - The Innovation Index gains 66%
Measuring Business Innovation Success
Innovation Index Group BUY Recommendations
Q1 2008 Report - Innovation Index ahead of S&P 500
Q2 2008 Report - Top Innovators Deliver
The Innovation Index Fund FAQ
Top 50 Innovative Companies in the world
Annual Report - Chapter One - Total Innovation Activity
Annual Report - Chapter Two - The Top Innovator
Annual Report - Chapter Three - The Innovation Insights
Innovation and Stock Performance Correlation
Future earnings guidance, A leading indicator
Smart Investing In Tough Economic Times
To Sell Or Not To Sell - You Decide
Creativity and Innovation Best Practices
Creativity and Innovation Case Studies

About the Innovation Index

The Innovation Index introduced in December 2006 is a weighted stock price index of the top 20 Innovators in North America.The Innovation Index returned 66% in 2007 based on performance model, and would have returned 174% over the previous five years (2002-2006) based on historical model*. This assumes equal investment in each stock of The Innovation Index as of December 31, 2001. An average of $100 invested in The Innovation Index on December 31, 2001 returned $454 as of December 31, 2007. By comparison, $100 invested in S&P 500 returned 28% or $129, $100 invested in NASDAQ returned 34% or $136, and $100 invested in the Dow Jones Index returned 30% or $131 through December 31, 2007. The Innovation Index beats the S & P 500, NASDAQ and Dow Jones Index by more than seven times over the past six years.

Alphabetical list of the Top 20 Innovators of The Innovation Index for 2008 and their stock ticker symbols:

3M Company - (NYSE: MMM)
Amazon.com, Inc. - (NASDAQ: AMZN)
America Movil - (NYSE: AMX)
Apple Inc. - (NASDAQ: AAPL)
AT&T Inc. - (NYSE: T)
Best Buy Co., Inc. - (NYSE: BBY)
Cisco Systems, Inc. - (NASDAQ: CSCO)
Costco Wholesale Corporation - (NASDAQ: COST)
eBay Inc. - (NASDAQ: EBAY)
General Electric Co. - (NYSE: GE)
Google Inc. - (NASDAQ: GOOG)
Hewlett-Packard Co. - (NYSE: HPQ)
Intel Corporation - (NASDAQ: INTC)
International Business Machines Corp. - (NYSE: IBM)
Merck & Co., Inc. - (NYSE: MRK)
McDonald's Corporation (NYSE: MCD)
Microsoft Corporation - (NASDAQ: MSFT)
NIKE, Inc. - (NYSE: NKE)
Research In Motion Limited - (NASDAQ: RIMM)
The Proctor & Gamble Company - (NYSE: PG)

The Innovation Index will analyze the positions and standings of the Top 20 Innovators at the end of each year. For 2008, there will be no further changes in The Innovation Index.

Disclaimer: The Innovation Index Group, Inc. invests in the stocks comprising The Innovation Index.
*Past Performance Does Not Guarantee Future Results

Thursday, October 23, 2008

Innovator Apple grows strong on surging iPhone demand

Apple profits are up 26% on iPhone boom. Apple shares were up 14% in after hours after Apple announced the earnings report. IIG is in excellent shape with Apple!

The best part of Apple earnings: CEO Steve Jobs attended the earnings call (which is quite rare), and had this to say:

Earnings Call: Jobs Says iPhone Revs Total $4.6B, Making Apple The Third-Largest Handset Maker

Apple (NasdaqGS: AAPL - News) CEO Steve Jobs made a special guest appearance on the company's earnings call to brag about the iPhone's stellar fourth-quarter performance, and to give his two-cents on how the consumer-electronics and computer company will be affected by the economic crisis as we head into the holiday shopping season. First, Apple's CFO Peter Oppenheimer explained Apple's new practice going forward of reporting non-GAAP financial results. Because the iPhone and Apple TV may provide free updates in the future, they are forced to spread out revenues for the devices over their lifetimes. Going forward, Apple will also report a non-GAAP financial measure that allows people to see how well the iPhone and Apple sales are currently doing. Under this new form of reporting, Oppenheimer said adjusted sales totaled $11.7 billion, or about $3.8 billion higher than its reported revenue, and adjusted net income was $2.4 billion, jumping by $1.3 billion than reported net income. "We believe this adds transparency to our business, and is helpful to you." Oppenheimer said because of the uncertainty in the market, they are going to be prudent in predicting results for the September quarter. He said Apple is targeting revenue of $9 to $10 billion and earnings per share between $1.06 and $1.35.

In a rare appearance, Steve Jobs joined the conference call to provide his outlook on the economy and detail the iPhone's Q4 performance. Jobs: "There's some remarkable things happening at Apple, but now it's all being done in front of the back drop of the economic global slowdown." Notes from the call, as reported by PaidContent.org :

-- On iPhone growth: Using the non-GAAP figures, Jobs said in the past quarter, the iPhone business has grown to $4.6 billion, representing 39 percent of Apple's overall revenues. "Clearly, it's too big for Apple or investors to ignore. The non-GAAP results are truly stunning." He said adjusted sales for the quarter are 48 percent higher than GAAP sales, and adjusted net income is 115 percent higher than reported net income. "It's more than double than reported net income...If this isn't stunning than I don't know what is, and it's all because of the success of the iPhone 3G."

-- On volume: Jobs said by selling 6.9 million iPhones during the quarter, Apple was able to beat RIM (NasdaqGS: RIMM - News), which sold 6.1 million Blackberry devices. "Apple outsold RIM last quarter. This is a milestone," considering Apple has only been in the market for 15 months.

-- Ranking by revenues: Jobs now claims that by revenues, Apple is the third largest mobile phone supplier in the world. Nokia (NYSE: NOK - News), is No. 1 at $12.7 billion; Samsung is No. 2 at $5.98 billion; Apple is No. 3 at $4.6 billion; Sony (NYSE: SNE - News) Ericsson (NasdaqGS: ERIC - News) is No. 4 at $4.2 billion; LG (SEO: 066570), No. 5, at $3.4 billion; Motorola (NYSE: MOT - News), No. 6, at $3.2 billion and RIM, No. 7, at $2.1 billion. "It's pretty amazing," but Jobs cautioned that they were able to sell that many by increasing the number of countries to 51 from 6, and that it's unclear if they can sustain that pace.

-- On the App Store: Jobs said tomorrow they will achieve the 200 millionth download from the App store after being available for only 102 days. "This is one area where we have completely changed the value proposition for mobile devices...We've never seen anything like this." Today, the App store has roughly 5,500 apps, which are being distributed in 62 countries. "Competitors are scrambling to copy our app store."

-- On the economy: Jobs told analysts and press on the call that they believe they will do fine because they have have good customers, good products, good employees, and $25 billion in cash and zero debt. Jobs: We will increase our R&D investments because they created some of the best products in the last downturn. "It is an extraordinary opportunity for companies that have the cash."

Apple shipped 2,611,000 Macintosh(R) computers during the quarter, representing 21 percent unit growth and 17 percent revenue growth over the year-ago quarter. The Company sold 11,052,000 iPods during the quarter, representing eight percent unit growth and three percent revenue growth over the year-ago quarter. Quarterly iPhone units sold were 6,892,000 compared to 1,119,000 in the year-ago-quarter.

Bottomline:
Apple revenue are up 27% and earnings are up 27% from prior year. Gross margin was 34.7 percent, up from 33.6 percent in the year-ago quarter. International sales accounted for 41 percent of the quarter's revenue. Traditionally, the last quarter of the year is Apple's best quarter. Considering the current economic downturn, even with a 20% conservative revenue and earnings growth, Apple will deliver $11.5 billion in revenue, and $1.89 billion in earnings; however, Apple is only providing guidance of $9 billion to $10 billion in revenue, and a broad range in earnings. Apple is definitely "low-balling" the guidance because of the current economy. Apple iPhone is a money making machine, and the iPhone will have even a greater impact on the earnings and revenue for the next quarter owing to Apple's accounting. Expect Apple to deliver another strong quarter, unless the economy completely unbuckles. Innovation Index Group has a BUY rating on Apple, and has a 12 month price target in the range of $160 to $190.

Innovation Index Reports

About The Innovation Index

The Innovation Index introduced in December 2006 is a weighted stock price index of the top 20 Innovators in North America.

The Innovation Index returned 66% in 2007 based on performance model, and would have returned 174% over the previous five years (2002-2006) based on historical model*. This assumes equal investment in each stock of The Innovation Index as of December 31, 2001. An average of $100 invested in The Innovation Index on December 31, 2001 returned $454 as of December 31, 2007. By comparison, $100 invested in S & P 500 returned 28% or $129, $100 invested in NASDAQ returned 34% or $136, and $100 invested in the Dow Jones Index returned 30% or $131 through December 31, 2007. The Innovation Index beats the S & P 500, NASDAQ and Dow Jones Index by more than seven times over the past six years.*

Alphabetical list of the Top 20 Innovators of The Innovation Index for 2008 and their stock ticker symbols:

3M Company - (NYSE: MMM)
Amazon.com, Inc. - (NASDAQ: AMZN)
America Movil - (NYSE: AMX)
Apple Inc. - (NASDAQ: AAPL)
AT&T Inc. - (NYSE: T)
Best Buy Co., Inc. - (NYSE: BBY)
Cisco Systems, Inc. - (NASDAQ: CSCO)
Costco Wholesale Corporation - (NASDAQ: COST)
eBay Inc. - (NASDAQ: EBAY)
General Electric Co. - (NYSE: GE)
Google Inc. - (NASDAQ: GOOG)
Hewlett-Packard Co. - (NYSE: HPQ)
Intel Corporation - (NASDAQ: INTC)
International Business Machines Corp. - (NYSE: IBM)
Merck & Co., Inc. - (NYSE: MRK)
McDonald's Corporation (NYSE: MCD)
Microsoft Corporation - (NASDAQ: MSFT)
NIKE, Inc. - (NYSE: NKE)
Research In Motion Limited - (NASDAQ: RIMM)
The Proctor & Gamble Company - (NYSE: PG)

The Innovation Index will analyze the positions and standings of the Top 20 Innovators at the end of each year. For 2008, there will be no further changes in The Innovation Index.

Disclaimer: The Innovation Index Group, Inc. invests in the stocks comprising The Innovation Index.
*Past Performance Does Not Guarantee Future Results


Innovator Google is still growing strong

Google delivered big this week!! And so did IBM earlier in the week. Apple is next and P&G to follow... our innovators are growing strong in tough economy. When the going gets tough, the tough get going! Google shares were up after earnings release!!

In a separate story, Warren Buffett came out telling everyone to BUY for the long-term:

Buffett's optimism is based primarily on the following:

  • "Be fearful when others are greedy, and be greedy when others are fearful. And most certainly, fear is now widespread, gripping even seasoned investors."
  • Cash is trash. "Today people who hold cash equivalents feel comfortable," he writes. "They shouldn't. They have opted for a terrible long-term asset, one that pays virtually nothing and is certain to depreciate in value."

Here is an analysis on Google and IBM:

Google Inc., owner of the most popular Internet search engine, advanced in Nasdaq trading after reporting profit that topped analysts' estimates, saying customers are still buying Web ads even as the economy slows. (Bloomberg reference)

While advertisers of home and auto loans cut back, makers of apparel and appliances kept spending, Chief Financial Officer Patrick Pichette said. Consumers continue to shop online, he said, with clicks on ads climbing 18 percent, near the previous quarter's 19 percent growth.

Google results, combined with better-than-anticipated reports from International Business Machines Corp. cheered investors after a decline in technology shares this month. Google showed resilience in a weakening economy, said Mark May, an analyst at Needham & Co. in New York.

``This really shows we need to give them the benefit of the doubt,'' said May, who recommends buying the shares (of Google). ``They should be able to weather the storm fairly well.''

Google's third-quarter net income rose 26 percent to $1.35 billion, or $4.24 a share, from $1.07 billion, or $3.38, a year earlier. Leaving out costs such as stock-based compensation, profit was $4.92 a share, beating the $4.75 average estimate of analysts in a Bloomberg survey.

Google, based in Mountain View, California, rose $18.03, or 5.1 percent, to $371.05 on the Nasdaq Stock Market at 9:50 a.m. New York time, after earlier reaching $378.97. The shares had dropped 49 percent this year before today.

Advertising Shift

Advertisers are cutting back on TV and print media spending in favor of ads that run alongside search listings. The Internet will account for 8.7 percent of the $284 billion in U.S. ad spending this year, up from 7.2 percent in 2007, according to Barclays Capital.

Excluding revenue passed on to partner sites, Google's sales expanded to $4.04 billion last quarter. Total revenue climbed 31 percent to $5.54 billion.

At least eight analysts had reduced their estimates for Google's third quarter this month after the global credit crisis erupted. That made it easier for the company to beat the average profit estimates yesterday.

``This was exactly the kind of shot in the arm that investors need,'' said Jeff Lindsay, an analyst with Sanford C. Bernstein & Co. in New York. ``People lost a lot of faith in the Internet, but this is exactly what the doctor ordered.''

New Contracts

IBM, based in Armonk, New York, said yesterday it signed $12.7 billion in contracts last quarter, topping the estimate of as much as $11 billion from Cowen & Co. analyst Louis Miscioscia. Winning contracts with the Royal Dutch Navy and Bristol-Myers Squibb Co. boosted the total.

``Tech is going to continue to be challenged for a period of time,'' Miscioscia, who has a neutral rating on IBM shares, said in an interview. ``To put this in perspective, IBM is up $2 after market, not $10, after falling about $20 since Oct. 1.''

Google handled 63 percent of U.S. online searches in August, double the market share of Yahoo! Inc. and Microsoft Corp. combined. That dominance has helped the company command higher prices for ads, according to Yahoo, which is awaiting government approval of an agreement to let Google sell some ads on its sites.

Cutting Back

Still, Google has reduced expenses by slowing its hiring rate and spending less on travel and events, said co-founder Sergey Brin.

``We don't know exactly what the future holds. We've taken a conservative approach,'' Brin said in an interview. ``We view this as an opportunity to refine our company and sharpen it.''

Capital expenditures fell to $452 million, down 18 percent from a year earlier, as Google made more efficient use of its computing centers, Brin said. He said he couldn't forecast whether the costs would continue to fall.

The credit crisis may cost the Internet ad market $6.7 billion in lost sales through 2010, according to Collins Stewart Plc. Big and small businesses, from General Motors Corp. to Simplexity LLC, are reducing ad spending plans, while some financial companies, such as Wachovia Corp., have disappeared.

Slower Growth?

The reductions will push down growth in U.S. Internet ad spending to less than 20 percent next year for the first time since 2002, said Sandeep Aggarwal, a Collins Stewart analyst in San Francisco. Advertisers will scale back spending on newspapers and broadcast TV networks, his firm said this month.

``Advertisers stay with the Internet because it's the way to reach the key younger demographic and that's what advertisers are really after,'' Timothy Ghriskey, chief investment officer at Solaris Asset Management LLC, said in an interview from Bedford Hills, New York.

Google, which gets almost all its revenue from Internet searches, is developing ways to advertise with images and video. The company struck a deal this month to show full-length programs from CBS Corp. on its YouTube site, splitting ad revenue with the network.

``The economic situation is so fluid that we're all sort of in uncharted territory,'' Chief Executive Officer Eric Schmidt said yesterday on a conference call. ``We've always been in this for the long term, and we believe that's even more important today than ever.''

Bottomline:
Google perhaps has the best business model - best of both worlds - when times are tough, and the economy is recessionary, advertisers market on Google and other search engines because they offer better value, better tracking and tighter budget controls. On the other hand, when the economy does improve, more advertisers will market more on Google because they simply have more money to spend. The only question is the rate of growth. But if Google can maintain 20% or better earnings and revenue growth in these trying times, this is simply remarkable. Innovation Index Group is long on Google, and is setting a revised target of $500 in 12 months.

Innovation Index Reports

About The Innovation Index

The Innovation Index introduced in December 2006 is a weighted stock price index of the top 20 Innovators in North America.

The Innovation Index returned 66% in 2007 based on performance model, and would have returned 174% over the previous five years (2002-2006) based on historical model*. This assumes equal investment in each stock of The Innovation Index as of December 31, 2001. An average of $100 invested in The Innovation Index on December 31, 2001 returned $454 as of December 31, 2007. By comparison, $100 invested in S & P 500 returned 28% or $129, $100 invested in NASDAQ returned 34% or $136, and $100 invested in the Dow Jones Index returned 30% or $131 through December 31, 2007. The Innovation Index beats the S & P 500, NASDAQ and Dow Jones Index by more than seven times over the past six years.*

Alphabetical list of the Top 20 Innovators of The Innovation Index for 2008 and their stock ticker symbols:

3M Company - (NYSE: MMM)
Amazon.com, Inc. - (NASDAQ: AMZN)
America Movil - (NYSE: AMX)
Apple Inc. - (NASDAQ: AAPL)
AT&T Inc. - (NYSE: T)
Best Buy Co., Inc. - (NYSE: BBY)
Cisco Systems, Inc. - (NASDAQ: CSCO)
Costco Wholesale Corporation - (NASDAQ: COST)
eBay Inc. - (NASDAQ: EBAY)
General Electric Co. - (NYSE: GE)
Google Inc. - (NASDAQ: GOOG)
Hewlett-Packard Co. - (NYSE: HPQ)
Intel Corporation - (NASDAQ: INTC)
International Business Machines Corp. - (NYSE: IBM)
Merck & Co., Inc. - (NYSE: MRK)
McDonald's Corporation (NYSE: MCD)
Microsoft Corporation - (NASDAQ: MSFT)
NIKE, Inc. - (NYSE: NKE)
Research In Motion Limited - (NASDAQ: RIMM)
The Proctor & Gamble Company - (NYSE: PG)

The Innovation Index will analyze the positions and standings of the Top 20 Innovators at the end of each year. For 2008, there will be no further changes in The Innovation Index.

Disclaimer: The Innovation Index Group, Inc. invests in the stocks comprising The Innovation Index.
*Past Performance Does Not Guarantee Future Results


References:

Bloomberg story reported by: Crayton Harrison in Dallas at tharrison5@bloomberg.net; Lauren Berry in New York at lberry4@bloomberg.net

Thursday, October 16, 2008

Top Innovators Weathering the Financial Storm

HEWLETT-PACKARD

only FOR WOMEN: Fashion designer Vivienne Tam flanked by President (PSG), Hewlett-Packard India, Ravi Swaminathan (left), and Senior Vice-President Global Marketing, Hewlett Packard, Satjiv S. Chahil

Hewlett-Packard unveiled four new laptops, including a special edition stylish notebook PC designed by U.S.-based renowned fashion designer Vivienne Tam. HP has about 33 percent market share in India's laptop segment.

Addressing a press conference here, HP's Senior Vice-President (Global Marketing) of Personal Systems Group (PSG) Satjiv S. Chahil said: "We continuously work to ensure that our HP Pavilion line appeals to new markets and segments. Vivienne's fresh and authentic design speaks to an intrinsic part of a digital lifestyle-personal expression." According to HP India's President (PSG) Ravi Swaminathan, the company plans to strengthen its market leadership position with an aggressive 'go-to-market' strategy by increasing its retail footprint across 650 cities and expanding retail partner network to over 10,000 by this year-end.

HP Vice President in an interview today on CNBC indicated that HP PC business remains robust, and touted Gartner report that shows growth of at least 15%.

HP shares are down 23.5% year to date. Innovation Index Group has a BUY recommendation on HP with a 12 month price target of $50 to $60.

PROCTOR & GAMBLE

Mr. A.G. Lafley, CEO of P&G, said: "The reason P&G has grown so consistently for so long is that we're a company that sticks to the fundamentals. We build brands that improve consumers' lives. We deliver superior value day in and day out. We manage cash and costs with unrelenting discipline. And we invest in innovation as the primary driver of profitable organic sales growth.
"While the economic environment remains volatile and uncertain, I am confident that P&G can and will continue to prosper over the long term. We are committed to ensuring P&G will continue to be a company you can count on."

P&G's net sales for the fiscal year ended June 30, 2008 increased nine percent to $83.5 billion, with organic sales up five percent - in the middle of the Company's four to six percent target range. Diluted earnings per share were $3.64, up 20 percent - or double the Company's ten percent target. P&G's free cash flow was $13.0 billion for the fiscal year, or 106 percent of net earnings - well above the Company's 90 percent goal.

P&G sales have nearly doubled for each of the past three decades - from $10 billion in 1980 to more than $80 billion today with earnings growth increasing from $640 million to $12 billion over the same period. Over the past five years, P&G has delivered 11 percent compound annual total return to shareholders, nine percent over the past ten years, and 16 percent over the past 20 years. The Company's dividends have also increased every year - more than nine percent a year, on average - over the past fifty-two years, and have been paid without interruption since the Company was incorporated 118 years ago. P&G recently announced a 40 cents dividend.

P&G shares are down 15.8% year to date. Innovation Index Group has a BUY recommendation on P&G with a 12 month price target of $75 to $85

APPLE

JP Morgan is upgrading Apple to Overweight from Neutral. Apple's model is far more diverse than previous vintages, and they think the staying power has been underappreciated. With its market share momentum likely intact, Apple in firm's view offers strong relative downside protection to the looming earnings reset that they expect to impact IT Hardware companies in coming weeks and again early next year.

- Diverse model provides staying power. There has been considerable investor concern lately over the Apple model losing steam, particularly if the consumer vertical rolls over. JPM estimates that the company's total model exposure is about 70-75% consumer, but they think that Apple's brand and market share momentum offer meaningful buffers to potential macro-driven pressures on the consumer.

- Retail expansion could sustain share gains and international momentum. JPM thinks a major force behind Apple's growth story will be its diversifying revenue streams. They expect Apple's penetration of the international markets to be measured in years and supported by the increasing build-out of the retail stores overseas.

- iPhone could lead to the enterprise or other content-rich devices. Firm thinks the iPhone could be a stepping stone to penetrating the enterprise. Also, they could envision the iPhone pushing Apple deeper into the set-top box market as the convergence of voice, web, data, and content continues.

- Expect numbers to come down across the sector, but Apple likely has a backstop beyond the first round. For Apple, they are revising their below-consensus revenue and EPS estimates. Looking to fiscal 2009, revenue and EPS estimates are $36.98 billion and $5.27, versus the Street consensus of $40.26 billion and $6.02.

- Apple trades at 18.8x JPM's calendar 2009 EPS estimate, versus the peer group average of 11.1x. With macro pressures showing no signs of dissipating, they believe it is time to play defense, and they think Apple can avoid having a major problem with the "E" in the price-to-earnings multiple moving through the coming year. Firm expects the company's model to limit a series of major earnings cuts from unfolding in coming quarters, and they think this should support a valuation gap in Apple's favor.

Apple announced new aluminum shell, more powerful laptops on October 14, and reduced the price on updated laptops to under $1,000. Apple is poised to see a robust growth in its sale of notebooks during the holiday season owing to competitive pricing and better features.

Apple shares are down 48.6% year to date. Innovation Index Group has a BUY rating on Apple, and is now updating the 12 month price target in the range of $160 to $190.

IBM

JPMorgan upgrades IBM as a stock that is a 'sturdy ship' in rough economic waters

A JPMorgan analyst upgraded International Business Machines Corp. saying the company's diverse and steady revenue streams make the stock a "sturdy ship" in the worsening economic environment, the firm said Wednesday.

Mark Moskowitz raised his rating to "Overweight" from "Neutral" because IBM has diverse revenue sources that offer relative stability. He also said at least half of the company's revenue comes from annual payments on long-term services and software contracts.

IBM represents a "flight to quality" for investors" due to its broad services, hardware and software reach," the analyst wrote. IBM 3Q profits jumped 20% from last year in large part due to services contracts.

IBM shares are down 15.3% year to date. Innovation Index Group has a BUY recommendation on IBM with a 12 month price target of $125 to $150.

These four innovators present attractive buying opportunity at the current price points.

Innovation Index Reports

About The Innovation Index

The Innovation Index introduced in December 2006 is a weighted stock price index of the top 20 Innovators in North America.

The Innovation Index returned 66% in 2007 based on performance model, and would have returned 174% over the previous five years (2002-2006) based on historical model*. This assumes equal investment in each stock of The Innovation Index as of December 31, 2001. An average of $100 invested in The Innovation Index on December 31, 2001 returned $454 as of December 31, 2007. By comparison, $100 invested in S & P 500 returned 28% or $129, $100 invested in NASDAQ returned 34% or $136, and $100 invested in the Dow Jones Index returned 30% or $131 through December 31, 2007. The Innovation Index beats the S & P 500, NASDAQ and Dow Jones Index by more than seven times over the past six years.*

Alphabetical list of the Top 20 Innovators of The Innovation Index for 2008 and their stock ticker symbols:

3M Company - (NYSE: MMM)
Amazon.com, Inc. - (NASDAQ: AMZN)
America Movil - (NYSE: AMX)
Apple Inc. - (NASDAQ: AAPL)
AT&T Inc. - (NYSE: T)
Best Buy Co., Inc. - (NYSE: BBY)
Cisco Systems, Inc. - (NASDAQ: CSCO)
Costco Wholesale Corporation - (NASDAQ: COST)
eBay Inc. - (NASDAQ: EBAY)
General Electric Co. - (NYSE: GE)
Google Inc. - (NASDAQ: GOOG)
Hewlett-Packard Co. - (NYSE: HPQ)
Intel Corporation - (NASDAQ: INTC)
International Business Machines Corp. - (NYSE: IBM)
Merck & Co., Inc. - (NYSE: MRK)
McDonald's Corporation (NYSE: MCD)
Microsoft Corporation - (NASDAQ: MSFT)
NIKE, Inc. - (NYSE: NKE)
Research In Motion Limited - (NASDAQ: RIMM)
The Proctor & Gamble Company - (NYSE: PG)

The Innovation Index will analyze the positions and standings of the Top 20 Innovators at the end of each year. For 2008, there will be no further changes in The Innovation Index.

Disclaimer: The Innovation Index Group, Inc. invests in the stocks comprising The Innovation Index.
*Past Performance Does Not Guarantee Future Results

Monday, October 13, 2008

U.S. Stock Markets Make Historical Jump

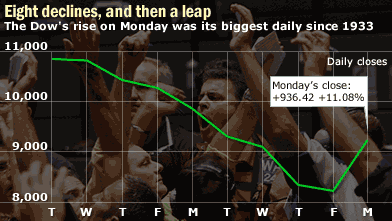
Dow Jones gains 936.42 points in one day, the biggest single day jump, a rise of 11.08%. The S&P 500 climbs 104.10 points, or 11.6%, to 1,003.32, the S&P's largest daily point jump. The Nasdaq Composite amasses 194.74 points, or 11.8%, to 1,844.25, the third-greatest percentage rise.

The Innovation Index Fund gains 30% in one day, the largest percentage increase in one day.

What is in store for tomorrow? Can the markets continue this rally?

Our outlook is that the U.S. stock markets will rebound further post November elections and post November options expiration. Whether they would finish the year in the positive remains to be seen.

Innovation Index Reports

About The Innovation Index

The Innovation Index introduced in December 2006 is a weighted stock price index of the top 20 Innovators in North America.

The Innovation Index returned 66% in 2007 based on performance model, and would have returned 174% over the previous five years (2002-2006) based on historical model*. This assumes equal investment in each stock of The Innovation Index as of December 31, 2001. An average of $100 invested in The Innovation Index on December 31, 2001 returned $454 as of December 31, 2007. By comparison, $100 invested in S & P 500 returned 28% or $129, $100 invested in NASDAQ returned 34% or $136, and $100 invested in the Dow Jones Index returned 30% or $131 through December 31, 2007. The Innovation Index beats the S & P 500, NASDAQ and Dow Jones Index by more than seven times over the past six years.*

Alphabetical list of the Top 20 Innovators of The Innovation Index for 2008 and their stock ticker symbols:

3M Company - (NYSE: MMM)
Amazon.com, Inc. - (NASDAQ: AMZN)
America Movil - (NYSE: AMX)
Apple Inc. - (NASDAQ: AAPL)
AT&T Inc. - (NYSE: T)
Best Buy Co., Inc. - (NYSE: BBY)
Cisco Systems, Inc. - (NASDAQ: CSCO)
Costco Wholesale Corporation - (NASDAQ: COST)
eBay Inc. - (NASDAQ: EBAY)
General Electric Co. - (NYSE: GE)
Google Inc. - (NASDAQ: GOOG)
Hewlett-Packard Co. - (NYSE: HPQ)
Intel Corporation - (NASDAQ: INTC)
International Business Machines Corp. - (NYSE: IBM)
Merck & Co., Inc. - (NYSE: MRK)
McDonald's Corporation (NYSE: MCD)
Microsoft Corporation - (NASDAQ: MSFT)
NIKE, Inc. - (NYSE: NKE)
Research In Motion Limited - (NASDAQ: RIMM)
The Proctor & Gamble Company - (NYSE: PG)

The Innovation Index will analyze the positions and standings of the Top 20 Innovators at the end of each year. For 2008, there will be no further changes in The Innovation Index.

Disclaimer: The Innovation Index Group, Inc. invests in the stocks comprising The Innovation Index.
*Past Performance Does Not Guarantee Future Results

Thursday, September 11, 2008

Beat the Wall Street - Take Control of Your Finances and Invest Profitably

HURRY! SPACE IS LIMITED!!

REGISTER TODAY FOR:

BEAT THE WALL STREET, TAKE CONTROL OF YOUR FINANCES AND INVEST PROFITABLY!


Do you want to profitably invest in the U.S. stock market and beat the Wall Street? Are you tired of losing money on your stock investments, paying fees on your investment accounts, and have even stopped looking at your monthly statements? Does your Investment Adviser provide you adequate choices to better invest your money? What financial strategies are you considering for your longer term investments, including your IRA? Innovation Index Group systematically invests in the Innovation Index, a weighted, stock index of The Top 20 Innovators in North America. We have delivered over 60% return since 2007 through systematic investment philosophy. Learn from us about disciplined Financial Strategies, the Innovation Index, and how to profitably invest in the American stock market.

Presenter:

Sanjay Dalal, President & Managing Director
Innovation Index Group, Inc.

Panelists:
Presenters from Entrust, Financial Companies and Real Estate / Mortgage Planners

Cost:
For a limited time, this web seminar is FREE (valued at over $100; only for the first thirty registrations)

Register for a session now by clicking a date below:

Wed, Sep 24, 2008 11:00 AM - 12:00 PM PDT

Wed, Oct 8, 2008 11:00 AM - 12:00 PM PDT

Wed, Oct 22, 2008 11:00 AM - 12:00 PM PDT

Wed, Nov 5, 2008 11:00 AM - 12:00 PM PST

Wed, Nov 19, 2008 11:00 AM - 12:00 PM PST

Wed, Dec 3, 2008 11:00 AM - 12:00 PM PST

Wed, Dec 17, 2008 11:00 AM - 12:00 PM PST


Once registered you will receive an email confirming your registration with information you need to join the Webinar.


Tuesday, August 26, 2008

Beat the Wall Street - Take Control of Your IRA and Invest Profitably

Beat the Wall Street - Take Control of Your IRA and Invest Profitably


Register for this Web Seminar (hurry, space is limited)

Do you want to profitably invest in the U.S. stock market and beat the stock markets? Are you tired of losing money on your IRA, paying fees on your IRA account, and have even stopped looking at your monthly statements? Does your IRA provide you adequate choices to better invest your money? What financial strategies are you considering for your longer term investments, especially with your IRA? Innovation Index Group systematically invests in the Innovation Index, a weighted, stock index of The Top 20 Innovators in North America. We have delivered over 60% return since 2007 through systematic investment philosophy. Learn from us about disciplined Financial Strategies, the Innovation Index, and how to profitably invest in the American stock market.

Presenters include
Kaaren Hall, Business Development Manager
Entrust Financial Services, LLC
and
Sanjay Dalal, President & Managing Director
Innovation Index Group, Inc.

Date: August 26, 2008
Time: 6 pm Pacific

Register for this FREE Web Seminar now (space is limited, valued at $150)

Thursday, June 26, 2008

Research In Motion and Nike continue torrid growth, show no slowdown

NIKE, Inc. (NYSE: NKE) and Research In Motion Limited (NASDAQ: RIMM) are 2 of the Top 20 Innovators of The Innovation Index.

Research In Motion Quarterly Revenue rises 107%, Quarterly Net Income zooms 116% year over year.
RIM Revenue for the first quarter of fiscal 2009 was $2.24 billion, up 19% from $1.88 billion in the previous quarter and up 107% from $1.08 billion in the same quarter of last year. The revenue breakdown for the quarter was approximately 82% for devices, 13% for service, 3% for software and 2% for other revenue. During the quarter, RIM shipped approximately 5.4 million devices.

Approximately 2.3 million net new BlackBerry(R) subscriber accounts were added in the quarter. At the end of the quarter, the total BlackBerry subscriber account base was over 16 million.

Net income for the quarter was $482.5 million, or $0.84 per share diluted, compared with net income of $412.5 million, or $0.72 per share diluted, in the prior quarter and net income of $223.2 million, or $0.39 per share diluted, in the same quarter last year.

Revenue for the second quarter of fiscal 2009 ending August 30, 2008 is expected to be in the range of $2.55-$2.65 billion. Net subscriber account additions in the second quarter are expected to be approximately 2.6 million. Earnings per share for the second quarter are expected to be in the range of $0.84-$0.89 per share diluted.
Nike delivers yet again, and stays with the high growth trajectory.
For the fiscal year, Nike revenues grew 14 percent to $18.6 billion, compared to $16.3 billion last year. Net income increased 26 percent to $1.9 billion, compared to $1.5 billion last year, and diluted earnings per share increased 28 percent to $3.74 versus $2.93 last year. For the fourth quarter, revenues increased 16 percent to $5.1 billion, compared to $4.4 billion for the same period last year. Fourth quarter net income increased 12 percent to $490.5 million, compared to $437.9 million in the prior year, and diluted earnings per share increased 14 percent to $0.98, versus $0.86 last year.

Future Orders

The Company reported worldwide futures orders for athletic footwear and apparel, scheduled for delivery from June 2008 through November 2008, totaling $8.8 billion, 11 percent higher than such orders reported for the same period last year.
Bottomline:

Both RIM and Nike are showing no slowdown from the U.S. economy. Both provided cautious future earnings outlook to account for potential slowdown in their U.S. earnings; however, the Wall Street analysts reacted to this realistic outlook gravely, and posted negative sentiment about the same. Both companies are still growing strong, and even their outlook shows solid top line revenue growth. RIM in particular slightly lowered the future net earnings owing to higher marketing costs attributed to launch of new products. Nothing unusual. However, the analysts are always seeking the smallest sign of weakness, and blowing it out of proportion. Nike also talked about weaker growth in the U.S. markets. And the same thing. Analysts reacted negatively to this. And their negative comments caused these stocks to go in a free fall, and even helped the market go down (it did not help that oil hit $140 a barrel). Both innovators are showing strong growth, and are not slowing down any time soon. Perhaps these Wall Street analysts need to get real, and revise their estimates in line with the U.S. economy and its impact on the global economy. I applaud both RIM and Nike management to provide conservative outlook. In time, the analysts and the investors will realize that both these companies are real gems, and will repeat the strong revenue and earnings growth. For now, the smart investor will get ample buying opportunity for these two top innovators.

Innovation Index Group has long-term BUY recommendations on the Top 20 Innovators of The Innovation Index, including RIM and Nike.

About Innovation Index Group:

Innovation Index Group, Inc. is a new investment management company focused on systematically identifying, tracking and investing in the most innovative publicly traded companies in North America – collectively called the Innovation Index. We have developed the Innovation Index Fund, LLC as our first vehicle to invest in the Innovation Index. Over the past six years, the Innovation Index would have generated a gross average annual return of 40% based on historical model.* The Innovation Index returned 66% in 2007*, and the Innovation Index Fund Manager is up 10% in 2008.*

Innovation Index Group, Inc. and Innovation Index Fund LLC are registered California Corporations, and member of the Irvine Chamber of Commerce in Orange County. Further, Innovation Index Fund LLC is an investment management company organized under the California state regulation, and is registered with Department of Corporations and SEC Regulation D.

The Innovation Index Reports:

Learn about The Innovation Index - Innovation Index Fund tracks The Innovation Index
The Innovation Index closes 2007 at 66% - 2007 Annual Report on the Innovation Index
Top 50 Innovative Companies in the world
- 2007 Report on Top 50 Innovative Companies
Annual Report - Chapter One - Total Innovation Activity - 2006 Annual Report One
Annual Report - Chapter Two - The Top Innovator - 2006 Annual Report Two
Annual Report - Chapter Three - The Innovation Insights - 2006 Annual Report Insights
Innovation and Stock Performance Correlation - The Innovation Index and Stock Performance

About The Innovation Index

The Innovation Index introduced in December 2006 is a weighted stock price index of the top 20 Innovators in North America.

The Innovation Index returned 66% in 2007 based on performance model, and would have returned 174% over the previous five years (2002-2006) based on historical model*. This assumes equal investment in each stock of The Innovation Index as of December 31, 2001. An average of $100 invested in The Innovation Index on December 31, 2001 returned $454 as of December 31, 2007. By comparison, $100 invested in S & P 500 returned 28% or $129, $100 invested in NASDAQ returned 34% or $136, and $100 invested in the Dow Jones Index returned 30% or $131 through December 31, 2007. The Innovation Index beats the S & P 500, NASDAQ and Dow Jones Index by more than seven times over the past six years.*

Alphabetical list of the Top 20 Innovators of The Innovation Index for 2008 and their stock ticker symbols:

3M Company - (NYSE: MMM)
Amazon.com, Inc. - (NASDAQ: AMZN)
America Movil - (NYSE: AMX)
Apple Inc. - (NASDAQ: AAPL)
AT&T Inc. - (NYSE: T)
Best Buy Co., Inc. - (NYSE: BBY)
Cisco Systems, Inc. - (NASDAQ: CSCO)
Costco Wholesale Corporation - (NASDAQ: COST)
eBay Inc. - (NASDAQ: EBAY)
General Electric Co. - (NYSE: GE)
Google Inc. - (NASDAQ: GOOG)
Hewlett-Packard Co. - (NYSE: HPQ)
Intel Corporation - (NASDAQ: INTC)
International Business Machines Corp. - (NYSE: IBM)
Merck & Co., Inc. - (NYSE: MRK)
McDonald's Corporation (NYSE: MCD)
Microsoft Corporation - (NASDAQ: MSFT)
NIKE, Inc. - (NYSE: NKE)
Research In Motion Limited - (NASDAQ: RIMM)
The Proctor & Gamble Company - (NYSE: PG)

The Innovation Index will analyze the positions and standings of the Top 20 Innovators at the end of each year. For 2008, there will be no further changes in The Innovation Index.

Disclaimer: The Innovation Index Group, Inc. invests in the stocks comprising The Innovation Index.
*Past Performance Does Not Guarantee Future Results

Tuesday, June 24, 2008

Smart Investing In Tough Economic Times

How do you invest in the stock market during a recession, and still make money? Especially, when the economy is stalling, inflation keeps growing, oil prices sky-rocketing, unemployment rising, and housing market collapsing - how do you keep an even keel, and go about doing business as usual while your investment portfolio may be sinking 10% to 20%, or worse?

One answer: Smart Investing!

Say you are buying a new car, new house, or a new business - what is the first question most people ask? How much does it cost? When it comes to car buying though, it frequently becomes a highly emotional decision - the buyer is not thinking of resale value, operating costs, and profits. Rather, how much fun would it be to drive this car, what would my friends say about it, and can I impress my girlfriend, boyfriend or someone special with it? Nowadays, another big question has entered the equation: mileage. How many miles for a gallon of gas? How many times you ask yourself this question when buying a car: Can I make a profit from buying the car? Just go ask the buyers of hot hybrids who were able to buy them at retail, and are making a tidy profit from selling them.

What about buying real estate? Either a primary home, secondary home, rental property, commercial or multi-unit? Again, cost is still the number one question - the down payment required to purchase the property. However, the home has to be appealing and elevating (to your senses) - especially the primary home. How many times have you bought a home that looked downright ugly? Perhaps never. Unless you are an expert in turnarounds, and are buying a cheap unit, can make it look pretty, and make a profit from it. With real estate, besides the cost, "affordability" becomes a real issue because most real-estate buys are in the hundreds of thousands, millions or even more. Can I afford this piece of real-estate? Do I have enough money to make a down payment, and then enough to make a monthly mortgage? Would the bank approve the loan? If this is my primary home, can I live happily for the next umpteen years without having to worry about mortgage? Again, the question on whether I would make a profit from my primary home is secondary. If you are buying an investment property, profits and cash flow are quite important. How soon can I recoup my down payment is another question that investors of real estate properties always think about. And the ability to create a monthly income through positive cash flow is relevant. Finally, how long do I hold this property before I can sell it for a profit - the time value of my investment and the potential returns thereof.

What about buying a business? Besides costs, profits, and cash flow, questions such as revenue, gross margins, operating costs, revenue growth, inventory, liabilities and debts enter into the equation. Now, one has to think about the management and people - who is running the show, and the ability to retain key talent after the acquisition. What about the products that the business sells, competition, customers, current market, and market opportunity? Is the market for this business growing or retreating? Is this business one of the top players, a second-rate player or a startup? What is the overall health of this business? What is the future outlook? All these questions must be answered before you buy a new business. And based on a thorough analysis, you make the decision to purchase - or not. Buying a business is perhaps the most important decision of anyone's professional career. If you make a good decision, you can profit from it; a bad decision, and you can lose all your capital. Your ability to manage and grow the business is also critical.

What does all this have to do with buying stocks and stock investing?

Purchasing stocks of a company, mutual funds, ETFs, or any stock investment for that matter should be the hardest decision you ever make - even harder than buying a car, buying a house, or buying a business. But the reality is - well we all the know the reality of investing in the stock market. We get a hot tip from a friend, a recommendation from a broker, see a particular stock running up, get influenced by an investor newsletter, read an investor journal, watch Jim Cramer's Mad Money or another investment show on TV - and we buy the stocks of a particular company, and invest our hard earned money. And wait. And wait. And wait. Wait for the stock to run up. To go up by 10%, 20% or more. But it does not. It actually drops in value. Now what do you do? Either sell out, or buy some more. All along you have not taken the time to understand the business whose stocks you have bought. Instead, you are just focused on making money somehow. And now you are emotionally attached to the stocks you have purchased. So you buy more stock at lowered value. And wait again. And wait some more. And the stock goes down further. Has this happened to you? Ultimately, you sell the stock for a huge loss, or just hold on to it, and see it drop further and further. Finally, you stop looking. If you got lucky though, you do end up making some money the first time. But the luck does run out eventually.

Smart Investing In Tough Economic Times

When the going gets tough, the tough gets going. Wish that was true for the stock market. Here is a quote from Benjamin Graham, considered by many as the father of investing, that everyone must live by if you ever consider investing in the stock market:

"An investment operation is one which, upon thorough analysis, promises safety of principal and a satisfactory return. Operations not meeting these requirements are speculative" - Benjamin Graham

Actually, what Graham says is true for any investment. You always want to make sure your invested capital, the principal, is safe - you want to minimize risk as much as you can. How do you do this? By doing a "thorough analysis" of the operation. And on top of that, you want to produce a healthy return from your investment that makes you happy. But Graham goes one step further by proclaiming that any investment that does not follow these two simple rules are speculative.

Warren Buffett, the most prolific investor of our times, and a student of Graham, has offered these simple tenets before purchasing a stock and investing in a particular business:

Business Tenets
  1. Is the business simple and understandable?
  2. Does the business have a consistent operating history?
  3. Does the business have favorable long-term prospects?
Management Tenets
  1. Is management rational?
  2. Is management candid with its shareholders?
  3. Does management resist the institutional imperative?
Financial Tenets
  1. What is the return on equity?
  2. What are the company's "owner earnings"?
  3. What are the profit margins?
  4. Has the company created at least one dollar of market value for every dollar retained?
Value Tenets
  1. What is the value of the company?
  2. Can it be purchased at a significant discount to its value?
(reference: The Warren Buffet Way)

Only after you get a satisfactory answer to each of the above questions should you consider investing into the stock of a particular company. Now you realize why investing into the stocks takes a lot of planning and research - the "thorough analysis" that Graham alluded to. For instance, under the Management Tenet, the question on whether "management resists the institutional imperative" has to do with management's focus: on the business, or managing the investors.

Innovation Index Group thoroughly analyzes the Top Innovators in North America, and only reports on those that show the highest potential for growth and minimize the risk to the principal.

Here is how Innovation Index Group determines the best companies:

Selection Methodology

The Innovators in The Innovation Index are determined using intensive factual research and analysis, leveraging the following resources:

1. Rankings of world’s top innovative companies as published by BusinessWeek and Boston Consulting Group

2. Rankings of the top Innovators as published by Forbes, Fortune and other business publications

3. Analysis of revenue, earnings, cash flow and management performance

4. Assessment of the tangible value of the Innovators including their brand value

5. Historical analysis of launched innovations – products, acquisitions, pricing, distribution, business model, services, process – and their impact on current and future revenue and earnings growth

6. Analysis of planned market innovations and potential revenue growth

7. Independent analysis by S & P, Zack’s, Barron’s, IBD and related resources

8. Complete analysis of the Innovators’ customers, competitors, environment and macro-economic factors that could impact their growth and stock performance

9. Wherever possible, interviews with key members of the management

Investment Principles

1. Isolate top Innovators that have demonstrated a solid history of innovations, revenue and earnings growth.

2. Conduct a thorough analysis based on facts to determine the intrinsic value of each selected Innovator relative to its market.

3. Track and invest in top Innovators, so that investments can be made when their stock is available at a discounted price compared to intrinsic value so that a "margin of safety" exists.

4. Increase or decrease investment in a particular Innovator based on appreciation or depreciation in its stock performance, changes in current or projected earnings or revenue growth, changes in management or other market factors.

5. Liquidation of investment in a particular Innovator based on set triggers for performance gains or losses, or change in top Innovators at the end of each calendar year.

Innovation Index Group is grounded on the belief that Top Innovators who have demonstrated a solid history of innovations, revenue and earnings growth are most likely to produce the highest stock market returns in the future. These Innovators need not be the top company by market cap for a particular sector; rather they could very well be challengers or “disrupters” that have demonstrated a real market for their products or services, are growing faster than the rate of the market (at times creating new markets altogether) and possibly grabbing market share from other competitors.

Differentiating Principles

The following principles differentiate our hypothetical investment methodology from other fund and investment managers:

1. Model Investments are limited to the crème de la crème– the best Innovators in their respective markets and industries are chosen after a complete, factual analysis as described earlier.

2. The Top 20 Innovators must each have a market cap of at least $10 billion and annual revenue of $2 billion. Thus, investments are limited to those Innovators who have grown into companies with a significant market capitalization and have demonstrated a superior history of revenue and earnings growth.

3. Model Investments for each Innovator are weighted based on the each Innovator’s launched innovations in the previous year, announced innovations for the upcoming year, market capitalization, earnings growth, revenue growth, projected earnings and revenue growth, analyst recommendations, historical and projected stock performance, current stock price, market fluctuations and its impact on the current stock price, “margin of safety,” and other micro and macro economic factors that could impact the growth of the innovator in the coming year.

4. A set percent of the available capital is set aside for short-term investments in the Innovators.

5. Model Investments are limited to the top 20 Innovators, because we believe on focusing on a select group of companies with the most growth potential.

Inflation needs to be stalled, and then reversed. Recession may last another couple of quarters or more, or may show modest turnaround within the next year. Housing industry may take the longest to recover. The Fed and the government are busy trying to help in all these areas by increasing liquidity in the financial markets, lowering the interest rates, providing rebate checks to consumers and families, and also beginning the work towards strengthening the dollar. The sooner these three elements improve for the American consumer, the better the chances of an economic rebound in the fourth quarter of 2008, and a resulting growth in the stock market.

Innovation Index Group believes that the U.S. economy will recover in the 2nd half of 2008, and the Top Innovators of The Innovation Index will reward the patient, long-term investor. So far, most of the top innovators have delivered solid earnings during the first quarter of 2008 owing to the strengths and growth in their global business, new innovations spurring new business growth, maintenance of US earnings, and benefits from the currency fluctuations. It would be great to witness a spiraling growth of their US earnings in the 2nd half 2008.

Innovation Index Group has long-term BUY recommendations on the Top 20 Innovators of The Innovation Index.

About Innovation Index Group:

Innovation Index Group, Inc. is a new research & management company focused on systematically identifying, tracking, researching and reporting on the most innovative publicly traded companies in North America – collectively called the Innovation Index. Over the past six years, the Innovation Index would have generated a gross average annual return of 40% based on historical model.* The Innovation Index returned 66% in 2007*.

The Innovation Index Reports:

Learn about The Innovation Index - Innovation Index Fund tracks The Innovation Index
The Innovation Index closes 2007 at 66% - 2007 Annual Report on the Innovation Index
Top 50 Innovative Companies in the world
- 2007 Report on Top 50 Innovative Companies
Annual Report - Chapter One - Total Innovation Activity - 2006 Annual Report One
Annual Report - Chapter Two - The Top Innovator - 2006 Annual Report Two
Annual Report - Chapter Three - The Innovation Insights - 2006 Annual Report Insights
Innovation and Stock Performance Correlation - The Innovation Index and Stock Performance

About The Innovation Index

The Innovation Index introduced in December 2006 is a weighted stock price index of the top 20 Innovators in North America.

The Innovation Index returned 66% in 2007 based on performance model, and would have returned 174% over the previous five years (2002-2006) based on historical model*. This assumes equal investment in each stock of The Innovation Index as of December 31, 2001. An average of $100 invested in The Innovation Index on December 31, 2001 returned $454 as of December 31, 2007. By comparison, $100 invested in S & P 500 returned 28% or $129, $100 invested in NASDAQ returned 34% or $136, and $100 invested in the Dow Jones Index returned 30% or $131 through December 31, 2007. The Innovation Index beats the S & P 500, NASDAQ and Dow Jones Index by more than seven times over the past six years.*

Alphabetical list of the Top 20 Innovators of The Innovation Index for 2008 and their stock ticker symbols:

3M Company - (NYSE: MMM)
Amazon.com, Inc. - (NASDAQ: AMZN)
America Movil - (NYSE: AMX)
Apple Inc. - (NASDAQ: AAPL)
AT&T Inc. - (NYSE: T)
Best Buy Co., Inc. - (NYSE: BBY)
Cisco Systems, Inc. - (NASDAQ: CSCO)
Costco Wholesale Corporation - (NASDAQ: COST)
eBay Inc. - (NASDAQ: EBAY)
General Electric Co. - (NYSE: GE)
Google Inc. - (NASDAQ: GOOG)
Hewlett-Packard Co. - (NYSE: HPQ)
Intel Corporation - (NASDAQ: INTC)
International Business Machines Corp. - (NYSE: IBM)
Merck & Co., Inc. - (NYSE: MRK)
McDonald's Corporation (NYSE: MCD)
Microsoft Corporation - (NASDAQ: MSFT)
NIKE, Inc. - (NYSE: NKE)
Research In Motion Limited - (NASDAQ: RIMM)
The Proctor & Gamble Company - (NYSE: PG)

The Innovation Index will analyze the positions and standings of the Top 20 Innovators at the end of each year. For 2008, there will be no further changes in The Innovation Index.

Disclaimer: The Innovation Index Group, Inc. invests in the stocks comprising The Innovation Index.
*Past Performance Does Not Guarantee Future Results


Wednesday, June 4, 2008

Innovation Index gains 12.23% in April and May 2008, beats major U.S. indices


Apr-08 May-08 Total* YTD
Innovation Index Fund 6.30% 5.58% 12.23% 8%
S&P 500 4.75% 1.07% 5.87% -6%
Dow Jones 4.54% -1.42% 3.06% -7%
Nasdaq 5.87% 4.55% 10.69% -6%

*Compounded for April and May

Innovation Index Fund had a solid performance jump in April and May 2008. Innovation Index Fund delivered 12.23% compounded return in two months, and handily beat S&P 500 and Dow Jones indices. Overall, the Innovation Index Fund is up 8% in 2008 as of May 31, 2008, whereas the major U.S. indices have lost 6% or 7% in 2008.

Innovation Index Group remains bullish for the 4th quarter of 2008; however, our understanding of the current market conditions lead us to believe that there will be some road bumps along the way. Particularly, during the summer months, the market may tread sideways or even course correct in the interim.

Three factors are critical for a second half turnaround in U.S. economy and its positive impact on the stock markets:

1. Inflation - Gross inflation that includes gas, utilities and food needs to come under control. The consumer will feel the pinch of $4 or higher price per gallon of gas in the interim (yesterday, I filled up at the cost of $4.25 a gallon for gas) and higher cost of basic groceries such as bread, milk and fresh vegetables. Either the consumer will adapt to the higher price of gasoline, or react by reducing gas consumption and thereby decreasing travel. Reducing consumption and decreasing travel will negatively impact the economy. Adaptation to a higher fuel price will either result in replacement of current automobiles to higher mileage hybrids, decrease in discretionary spending elsewhere, utilization of public transport or carpools. This will take time, and neither of these alternatives appear to create a net positive impact on the economy. Finally, higher food prices would not deter the monthly consumption of groceries; however, the consumer will likely spend less money for other necessities or luxuries.

U.S. Federal Reserve Chairman Ben Bernanke said rising long-term inflation expectations were a "significant concern" for policy-makers but dismissed worry a wage-price inflation spiral was developing. "Some indicators of longer-term inflation expectations have risen in recent months, which is a significant concern for the Federal Reserve," Bernanke told graduating students at Harvard University. "We will need to monitor that situation closely."

He described overall inflation as "significantly higher than we would like," the second straight day in which he sounded a warning on inflation, which financial markets took as a firm signal that interest rates are likely on hold for some time.

2. Recession - U.S. employers shed 63,000 jobs in February 2008, the most in five years, 81,000 jobs in March and 20,000 jobs in April. How long will it take for the economy to turnaround and produce meaningful job growth? Would corporations go back to hiring mode in summer months or earlier? Which jobs will be in demand? So far, there are mixed signals on whether the economy is in recession or not, because the US economy actually grew in the first quarter by 0.6%.

Construction lost 61,000 jobs in April, and manufacturing shed 46,000 jobs. Retailers also trimmed payrolls by 27,000 in the face of a pullback in spending by consumers - CNN Money.

But some other sectors that had posted job losses in previous reports rebounded, such as business and professional services, which grew by 39,000 jobs after a loss of 44,000 the previous month. The financial sector, which has lost jobs each of the previous 8 months due to problems in the credit markets, ended that streak with a narrow 3,000 job gain. Unemployment rate actually improved to 5% in April 2008.

3. Housing and Financials - Some analysts call this period the "biggest slump in US housing".

Economist Glen Langan points out, "the unusual focus on subprime has caused the nation to overlook a broader trend regarding the housing sector -- namely, the psychology of the housing market."

"What we're not grasping yet, as a nation, is that even with programs to help people stay in their homes and avoid foreclosure, the public's stance toward the housing market has changed," Langan said. "The psychology of the housing market has changed. And this has little to do with at-risk mortgages. This a psychological shift among middle-income and upper-middle-income homeowners and taxpayers. It looks like they'll be sitting on the fence for a long period of time, and this will delay the housing recovery, hurting the economy in the process."

What's at the root of the psychological shift? Langan said factors that clearly indicate that tougher economic times are here and up ahead (higher oil prices, food prices, job lay-offs and little or no U.S. economic growth) combined with high home inventory levels -- about a 9.5- to 10-month supply at current sales rates -- telegraph to Americans that, unless you live in an oil boom town, median home prices are not going to recover any time soon, "not this year, and probably not in 2009."

According to this Bloomberg story, the number of Americans in danger of losing their homes to foreclosure rose to the highest in almost three decades during the first quarter as borrowers who fell behind on payments were unable to sell their homes.

New foreclosures rose to a seasonally adjusted 0.99 percent of all U.S. home loans, up from 0.83 percent in the fourth quarter, the Mortgage Bankers Association said in a report today. The total inventory of homes in foreclosure increased to 2.47 percent and the delinquency rate, loans with one or more payments overdue, grew to 6.35 percent. All were the highest since 1979, the Washington-based trade group said.

Falling home prices have stalled U.S. real estate sales, making it difficult for people who can't pay their mortgages to sell the properties. The increase in foreclosures was led by states with the biggest price declines over the past two years, said Jay Brinkmann, MBA's vice president of research and economics. California, Florida, Nevada and Arizona accounted for 89 percent of the gain in new foreclosures, he said.

Bottomline:

Inflation needs to be stalled, and then reversed. Recession may last another couple of quarters or more, or may show modest turnaround within the next year. Housing industry may take the longest to recover. The Fed and the government are busy trying to help in all these areas by increasing liquidity in the financial markets, lowering the interest rates, providing rebate checks to consumers and families, and also beginning the work towards strengthening the dollar. The sooner these three elements improve for the American consumer, the better the chances of an economic rebound in the fourth quarter of 2008, and a resulting growth in the stock market.

Innovation Index Group believes that the U.S. economy will recover in the 2nd half of 2008, and the Top Innovators of The Innovation Index will reward the patient, long-term investor. So far, most of the top innovators have delivered solid earnings during the first quarter of 2008 owing to the strengths and growth in their global business, new innovations spurring new business growth, maintenance of US earnings, and benefits from the currency fluctuations. It would be great to witness a spiraling growth of their US earnings in the 2nd half 2008.

Innovation Index Group has long-term BUY recommendations on the Top 20 Innovators of The Innovation Index.

About Innovation Index Group:

Innovation Index Group, Inc. is a new investment management company focused on systematically identifying, tracking and investing in the most innovative publicly traded companies in North America – collectively called the Innovation Index. We have developed the Innovation Index Fund, LLC as our first vehicle to invest in the Innovation Index. Over the past six years, the Innovation Index would have generated a gross average annual return of 40% based on historical model.* The Innovation Index returned 66% in 2007, and the Innovation Index Fund Manager is up 10% in 2008.*

Innovation Index Group, Inc. and Innovation Index Fund LLC are registered California Corporations, and member of the Irvine Chamber of Commerce in Orange County. Further, Innovation Index Fund LLC is an investment management company organized under the California state regulation, and is registered with Department of Corporations and SEC Regulation D.

The Innovation Index Reports:

Invest in The Innovation Index - Innovation Index Fund tracks The Innovation Index
The Innovation Index closes 2007 at 66% - 2007 Annual Report on the Innovation Index
Top 50 Innovative Companies in the world
- 2007 Report on Top 50 Innovative Companies
Annual Report - Chapter One - Total Innovation Activity - 2006 Annual Report One
Annual Report - Chapter Two - The Top Innovator - 2006 Annual Report Two
Annual Report - Chapter Three - The Innovation Insights - 2006 Annual Report Insights
Innovation and Stock Performance Correlation - The Innovation Index and Stock Performance

About The Innovation Index

The Innovation Index introduced in December 2006 is a weighted stock price index of the top 20 Innovators in North America.

The Innovation Index returned 66% in 2007 based on performance model, and would have returned 174% over the previous five years (2002-2006) based on historical model*. This assumes equal investment in each stock of The Innovation Index as of December 31, 2001. An average of $100 invested in The Innovation Index on December 31, 2001 returned $454 as of December 31, 2007. By comparison, $100 invested in S & P 500 returned 28% or $129, $100 invested in NASDAQ returned 34% or $136, and $100 invested in the Dow Jones Index returned 30% or $131 through December 31, 2007. The Innovation Index beats the S & P 500, NASDAQ and Dow Jones Index by more than seven times over the past six years.*

Alphabetical list of the Top 20 Innovators of The Innovation Index for 2008 and their stock ticker symbols:

3M Company - (NYSE: MMM)
Amazon.com, Inc. - (NASDAQ: AMZN)
America Movil - (NYSE: AMX)
Apple Inc. - (NASDAQ: AAPL)
AT&T Inc. - (NYSE: T)
Best Buy Co., Inc. - (NYSE: BBY)
Cisco Systems, Inc. - (NASDAQ: CSCO)
Costco Wholesale Corporation - (NASDAQ: COST)
eBay Inc. - (NASDAQ: EBAY)
General Electric Co. - (NYSE: GE)
Google Inc. - (NASDAQ: GOOG)
Hewlett-Packard Co. - (NYSE: HPQ)
Intel Corporation - (NASDAQ: INTC)
International Business Machines Corp. - (NYSE: IBM)
Merck & Co., Inc. - (NYSE: MRK)
McDonald's Corporation (NYSE: MCD)
Microsoft Corporation - (NASDAQ: MSFT)
NIKE, Inc. - (NYSE: NKE)
Research In Motion Limited - (NASDAQ: RIMM)
The Proctor & Gamble Company - (NYSE: PG)

The Innovation Index will analyze the positions and standings of the Top 20 Innovators at the end of each year. For 2008, there will be no further changes in The Innovation Index.

Disclaimer: The Innovation Index Group, Inc. invests in the stocks comprising The Innovation Index.
*Past Performance Does Not Guarantee Future Results