Showing posts with label stocks. Show all posts

Tuesday, January 20, 2009

IBM - Top 20 Innovator of the Innovation Index for 2009

"To be honest, I didn't believe they could show something like this -- I think the results they posted were stellar," said Peter Misek, an analyst with Canaccord Adams. "They just executed really well -- really, really, really well."

IBM (NYSE: IBM) predicted at least $9.20 per share in profit in 2009, a full 45 cents per share better than the average estimate of analysts polled by Thomson Reuters. Is IBM for real?

IBM's net income for the 4th quarter was $4.4 billion, or $3.28 per share - beating the analyst estimates of $3.03 per share by a full 25 cents! WOW! Net income showed 12 percent profit increase from $3.95 billion, or $2.80 per share, in the same period a year earlier.

Selected references:
Leading eBook on Creativity and Innovation in Business
Creativity and Innovation Best Practices
Creativity and Innovation Case Studies
The Innovation Index
Top 50 innovative companies in the world

IBM's key revenue generator: $17.2 billion in new services contracts. IBM is executing quite efficiently in this trying economy, and has a workforce of 400,000 employees worldwide. IBM did not post a sales gain though. The sales were down sequentially by 1%, adjusted for currency fluctuations, from the previous year's quarter.

"A strong fourth quarter capped an outstanding year. In 2008 IBM performed well in an extremely difficult economic environment. Clearly our strategic transformation --- migrating to the more profitable segments of the industry, investing in growth regions of the world, and driving productivity through global integration --- is continuing to pay dividends," said Samuel J. Palmisano, IBM chairman, president and chief executive officer.

IBM gets the nod as a Top 20 Innovator of the Innovation Index for 2009. Bravo, IBM!!

The Innovation Index Reports
Introducing The Innovation Index
The Innovation Index 2008 Performance
The Iron Men of Stocks
Annual Report 2007 - The Innovation Index gains 66%
Measuring Business Innovation Success
Top 50 Innovative Companies in the world
Annual Report - Chapter One - Total Innovation Activity
Annual Report - Chapter Two - The Top Innovator
Annual Report - Chapter Three - The Innovation Insights
Innovation and Stock Performance Correlation
Future earnings guidance, A leading indicator
Smart Investing In Tough Economic Times
To Sell Or Not To Sell - You Decide
Creativity and Innovation Best Practices
Creativity and Innovation Case Studies

About the Innovation Index

The Innovation Index introduced in December 2006 is a weighted stock price index of the top 20 Innovators in North America.


References:
IBM Press Release
AP Story

Friday, January 16, 2009

The Iron Men of Stocks - Top 20 Innovators of the Innovation Index

Company Name

Symbol

Market Cap

52w Price Change (%)

Return On Investment (5 Yr Avg) (%)

5y Revenue Growth Rate

5y Net Income Growth Rate

5y EPS Growth Rate


Accenture Ltd.

ACN

23.54B

0.73

52.94

13.57

27.70

20.30


Apollo Group, Inc.

APOL

14.23B

12.64

48.42

18.58

15.51

17.11


Genentech, Inc.

DNA

89.53B

22.34

15.14

35.32

112.58

111.77


General Mills, Inc.

GIS

19.86B

6.63

8.40

5.38

7.14

8.86


McDonald's Corporation

MCD

66.50B

10.75

9.44

8.14

18.67

20.01


Rohm and Haas Company

ROH

11.83B

27.38

7.26

9.21

25.74

27.01


Wal-Mart Stores, Inc.

WMT

202.25B

7.69

14.04

10.34

10.51

12.47


Waste Management, Inc.

WMI

15.89B

4.19

6.00

3.49

7.24

10.89


Only 8 U.S. businesses, worth at least $10 billion in market cap, provided positive returns in 2008! In a year when Dow Jones was down 33.84%, S&P 500 was down 38.49% and NASDAQ was down 40.54%, these Iron Men of Stocks provided positive returns! This is absolutely phenomenal. If these bellwethers can stay positive in this greatest recession of our times, they are bound to perform even better when the markets rebound. Would they?


On an average, these Iron Men provide returns of over 20% every year. 6 out of the 8 companies provide an annual dividend also. 1 out of these 8 Iron Men, McDonald's, was the Top Innovator by stock performance of the Innovation Index in 2008. Are these 8 U.S. businesses our top picks for 2009? Are these the best investment options for 2009? It depends. Whereas these companies may not provide the best returns in 2009, if and when the markets do rebound, they could provide a positive return and help you against further downturn. They are proven!

So, we announce our top 6 innovative companies for 2009! These Iron Men are our top 6 innovators for 2009 (2 innovators: Rohm and Haas and Genentech are in the process of getting acquired in 2009). These top 8 Innovators find ways to grow their business annually - average of 13% annual revenue growth, improve their earnings per share annually - average EPS growth of 28.55% annually, provide positive stock returns in a downturn - average return of 11.54% during the last 52 weeks, and adequate cash per share to grow their business that helps them survive the downturn - average cash per share of $2.36 per company.

Who will round out the Top 20 Innovators? 14 new innovators will be announced early next week to complete our Top 20 Innovators for 2009.

Here is a brief summary of each innovator (from Google Finance):

Accenture Limited (Accenture) is a management consulting, technology services and outsourcing organization. The Company’s business is structured around five operating groups, which together comprise 17 industry groups serving clients. The operating groups of the Company are Communications & High Tech, Financial Services, Products, Public Service and Resources

Apollo Group, Inc. (Apollo Group) is a private education provider. The Company offers educational programs and services at the high school, undergraduate and graduate levels online and on-campus through its wholly owned subsidiaries, The University of Phoenix, Inc. (University of Phoenix), Institute for Professional Development (IPD), The College for Financial Planning Institutes Corporation (CFP), Western International University, Inc. (Western International University), and Insight Schools, Inc. (Insight Schools), and through its 80.1% owned subsidiary, Apollo Global, Inc. (Apollo Global). The Company has also established a Canadian institution, Meritus University (Meritus), which began operations in September 2008

Genentech, Inc. (Genentech) is a biotechnology company that discovers, develops, manufactures and commercializes pharmaceutical products to treat patients with unmet medical needs. It commercializes multiple biotechnology products and also receives royalties from companies that are licensed to market products based on the Company’s technology. Genentech commercializes various products in the United States, including Avastin, Rituxan, Herceptin, Lucentis, Xolair, Tarceva, Nutropin, Activase, TNKase, Cathflo Activase, Pulmozyme and Raptiva. The Company’s licensed products include Trastuzumab, Rituximab, Bevacizumab, Dornase alfa, recombinant, Alteplase and Tenecteplase, Somatropin, Daclizumab, Ranibizumab, Etanercept, Adalimumab and Infliximab. As of July 21, 2008, Roche Holding Ltd. held a 55.9% interest in Genentech, Inc., a biotechnology company. Note: Roche Holding Ltd. announced plans to acquire all of Genentech on July 21, 2008.

General Mills, Inc. (General Mills) is a manufacturer and marketer of branded consumer foods sold through retail stores. The Company is a supplier of branded and unbranded food products to the foodservice and commercial baking industries. General Mills manufactures its products in 16 countries and market them in more than 100 countries. Its joint ventures manufacture and market products in more than 130 countries and republics worldwide. The Company’s major product categories in the United States are ready-to-eat cereals, refrigerated yogurt, ready-to-serve soup, dry dinners, shelf stable and frozen vegetables, refrigerated and frozen dough products, dessert and baking mixes, frozen pizza and pizza snacks, grain, fruit and savory snacks, microwave popcorn, and a variety of organic products including soup, granola bars, and cereal. General Mills operates in three operating segments: U.S. Retail; International; and Bakeries and Foodservice.

McDonald’s Corporation primarily franchises and operates McDonald’s restaurants in the food service industry. These restaurants serve a varied, yet limited, value-priced menu in more than 100 countries around the world. The Company also has a minority ownership interest in United Kingdom-based Pret A Manger. The Company owned Boston Market prior to its sale in August 2007. During the year ended December 31, 2006, the Company disposed of its investment in Chipotle Mexican Grill (Chipotle). All restaurants are operated either by the Company, by independent entrepreneurs under the terms of conventional franchise arrangements (franchisees), or by affiliates and developmental licensees operating under license agreements. During the year ended December 31, 2007, McDonald’s Corporation sold its businesses in Brazil, Argentina, Mexico, Puerto Rico, Venezuela and 13 other countries in Latin America, and the Caribbean to a developmental licensee organization. Note: McDonald's was a Top 20 Innovator in 2008.

Rohm and Haas Company is a specialty materials company. The Company operates through seven segments: electronic technologies, display technologies, primary materials, paint and coatings materials, packaging and building materials, performance materials group and salt. On June 15, 2007, the Company acquired the Eastman Kodak Company’s light management films technology business, which produces advanced films that improve the display of liquid crystal displays (LCD). On November 30, 2007, it acquired a 51% ownership interest in a joint venture formed with SKC, Co. Ltd. In April 2008, the Company acquired Gracel Display, Inc., a developer and manufacturer of organic light emitting diode (OLED) materials. In April 2008, the Company also completed the acquisition of the FINNDISP polymer dispersions division of OY Forcit AB. Note: In 2008, Dow Chemical announced plans to acquire Rohm and Haas Company.

Wal-Mart Stores, Inc. (Wal-Mart) operates retail stores in various formats around the world. The Company earns the trust of its customers every day by providing an assortment of merchandise and services at every day low prices (EDLP), while fostering a culture that rewards and embraces mutual respect, integrity and diversity. Wal-Mart’s operations comprise three business segments: Wal-Mart Stores, Sam’s Club and International. Its Wal-Mart Stores segment is the largest segment of the Company’s business, accounting for 64% of its net sales, during the fiscal year ended January 31, 2008 (fiscal 2008), and operates stores in three different formats in the United States, as well as Wal-Mart’s online retail operations, walmart.com. Its Sam’s Club segment consists of membership warehouse clubs in the United States and the segment’s online retail operations, samsclub.com. Sam’s Club accounted for 11.8% of the Company’s net sales during fiscal 2008. Note: Wal-Mart was a Top 20 Innovator in 2007 and 2006.

Waste Management, Inc. (WMI) is a provider of integrated waste services in North America. Through its subsidiaries the Company provides collection, transfer, recycling, disposal and waste-to-energy services. WMI’s customers include commercial, industrial, municipal and residential customers, other waste management companies, electric utilities and governmental entities. The Company operates in six operating groups, of which four are organized by geographic area and two are organized by function. The geographic groups include WMI’s Eastern, Midwest, Southern and Western Groups, and the two functional groups are its Wheelabrator Group and WM Recycle America (WMRA) Group. The Company also provides additional waste management services that are not managed through its six Groups. These services include in-plant services, methane gas recovery and third-party sub-contracted and administrative services.

Selected references:
Leading eBook on Creativity and Innovation in Business
Creativity and Innovation Best Practices
Creativity and Innovation Case Studies
The Innovation Index
Top 50 innovative companies in the world

The Innovation Index Reports

Introducing The Innovation Index
Annual Report 2007 - The Innovation Index gains 66%
Measuring Business Innovation Success
Innovation Index Group BUY Recommendations
Q1 2008 Report - Innovation Index ahead of S&P 500
Q2 2008 Report - Top Innovators Deliver
The Innovation Index Fund FAQ
Top 50 Innovative Companies in the world
Annual Report - Chapter One - Total Innovation Activity
Annual Report - Chapter Two - The Top Innovator
Annual Report - Chapter Three - The Innovation Insights
Innovation and Stock Performance Correlation
Future earnings guidance, A leading indicator
Smart Investing In Tough Economic Times
To Sell Or Not To Sell - You Decide
Creativity and Innovation Best Practices
Creativity and Innovation Case Studies

About the Innovation Index

The Innovation Index introduced in December 2006 is a weighted stock price index of the top 20 Innovators in North America. The Innovation Index was down 38.72% in 2008 based on equal investment in each innovator of the Innovation Index. The Innovation Index returned 66% in 2007 based on performance model*. The Innovation Index would have returned 174% over the previous five years (2002-2006) based on historical model*. This assumes equal investment in each stock of The Innovation Index as of December 31, 2001. An average of $100 invested in The Innovation Index on December 31, 2001 returned $454 as of December 31, 2007. By comparison, $100 invested in S&P 500 returned 28% or $129, $100 invested in NASDAQ returned 34% or $136, and $100 invested in the Dow Jones Index returned 30% or $131 through December 31, 2007.

Alphabetical list of the Top 20 Innovators of The Innovation Index for 2008 and their stock ticker symbols:

3M Company - (NYSE: MMM)
Amazon.com, Inc. - (NASDAQ: AMZN)
America Movil - (NYSE: AMX)
Apple Inc. - (NASDAQ: AAPL)
AT&T Inc. - (NYSE: T)
Best Buy Co., Inc. - (NYSE: BBY)
Cisco Systems, Inc. - (NASDAQ: CSCO)
Costco Wholesale Corporation - (NASDAQ: COST)
eBay Inc. - (NASDAQ: EBAY)
General Electric Co. - (NYSE: GE)
Google Inc. - (NASDAQ: GOOG)
Hewlett-Packard Co. - (NYSE: HPQ)
Intel Corporation - (NASDAQ: INTC)
International Business Machines Corp. - (NYSE: IBM)
Merck & Co., Inc. - (NYSE: MRK)
McDonald's Corporation (NYSE: MCD)
Microsoft Corporation - (NASDAQ: MSFT)
NIKE, Inc. - (NYSE: NKE)
Research In Motion Limited - (NASDAQ: RIMM)
The Proctor & Gamble Company - (NYSE: PG)

The Innovation Index will analyze the positions and standings of the Top 20 Innovators at the end of each year.

About Innovation Index Group:

Innovation Index Group, Inc. systematically identifies, tracks, researches and analyzes the most innovative publicly traded companies in North America – collectively called the Innovation Index. Over the past six years, the Innovation Index would have generated a gross average annual return of 40% based on historical model.* The Innovation Index returned 66% in 2007* based on performance model, and was down 38.72% in 2008*.

Disclaimer: Innovation Index Fund invested in the stocks comprising The Innovation Index, and is currently closed.
*Past Performance Does Not Guarantee Future Results. Investments are not FDIC insured, do not have bank guarantee, and may lose value including principal. Please consult your financial adviser before making any investments.

References:
Stock screener: Courtesy of Google Finance
Company summary: Courtesy of Google Finance

Thursday, October 16, 2008

Top Innovators Weathering the Financial Storm

HEWLETT-PACKARD

only FOR WOMEN: Fashion designer Vivienne Tam flanked by President (PSG), Hewlett-Packard India, Ravi Swaminathan (left), and Senior Vice-President Global Marketing, Hewlett Packard, Satjiv S. Chahil

Hewlett-Packard unveiled four new laptops, including a special edition stylish notebook PC designed by U.S.-based renowned fashion designer Vivienne Tam. HP has about 33 percent market share in India's laptop segment.

Addressing a press conference here, HP's Senior Vice-President (Global Marketing) of Personal Systems Group (PSG) Satjiv S. Chahil said: "We continuously work to ensure that our HP Pavilion line appeals to new markets and segments. Vivienne's fresh and authentic design speaks to an intrinsic part of a digital lifestyle-personal expression." According to HP India's President (PSG) Ravi Swaminathan, the company plans to strengthen its market leadership position with an aggressive 'go-to-market' strategy by increasing its retail footprint across 650 cities and expanding retail partner network to over 10,000 by this year-end.

HP Vice President in an interview today on CNBC indicated that HP PC business remains robust, and touted Gartner report that shows growth of at least 15%.

HP shares are down 23.5% year to date. Innovation Index Group has a BUY recommendation on HP with a 12 month price target of $50 to $60.

PROCTOR & GAMBLE

Mr. A.G. Lafley, CEO of P&G, said: "The reason P&G has grown so consistently for so long is that we're a company that sticks to the fundamentals. We build brands that improve consumers' lives. We deliver superior value day in and day out. We manage cash and costs with unrelenting discipline. And we invest in innovation as the primary driver of profitable organic sales growth.
"While the economic environment remains volatile and uncertain, I am confident that P&G can and will continue to prosper over the long term. We are committed to ensuring P&G will continue to be a company you can count on."

P&G's net sales for the fiscal year ended June 30, 2008 increased nine percent to $83.5 billion, with organic sales up five percent - in the middle of the Company's four to six percent target range. Diluted earnings per share were $3.64, up 20 percent - or double the Company's ten percent target. P&G's free cash flow was $13.0 billion for the fiscal year, or 106 percent of net earnings - well above the Company's 90 percent goal.

P&G sales have nearly doubled for each of the past three decades - from $10 billion in 1980 to more than $80 billion today with earnings growth increasing from $640 million to $12 billion over the same period. Over the past five years, P&G has delivered 11 percent compound annual total return to shareholders, nine percent over the past ten years, and 16 percent over the past 20 years. The Company's dividends have also increased every year - more than nine percent a year, on average - over the past fifty-two years, and have been paid without interruption since the Company was incorporated 118 years ago. P&G recently announced a 40 cents dividend.

P&G shares are down 15.8% year to date. Innovation Index Group has a BUY recommendation on P&G with a 12 month price target of $75 to $85

APPLE

JP Morgan is upgrading Apple to Overweight from Neutral. Apple's model is far more diverse than previous vintages, and they think the staying power has been underappreciated. With its market share momentum likely intact, Apple in firm's view offers strong relative downside protection to the looming earnings reset that they expect to impact IT Hardware companies in coming weeks and again early next year.

- Diverse model provides staying power. There has been considerable investor concern lately over the Apple model losing steam, particularly if the consumer vertical rolls over. JPM estimates that the company's total model exposure is about 70-75% consumer, but they think that Apple's brand and market share momentum offer meaningful buffers to potential macro-driven pressures on the consumer.

- Retail expansion could sustain share gains and international momentum. JPM thinks a major force behind Apple's growth story will be its diversifying revenue streams. They expect Apple's penetration of the international markets to be measured in years and supported by the increasing build-out of the retail stores overseas.

- iPhone could lead to the enterprise or other content-rich devices. Firm thinks the iPhone could be a stepping stone to penetrating the enterprise. Also, they could envision the iPhone pushing Apple deeper into the set-top box market as the convergence of voice, web, data, and content continues.

- Expect numbers to come down across the sector, but Apple likely has a backstop beyond the first round. For Apple, they are revising their below-consensus revenue and EPS estimates. Looking to fiscal 2009, revenue and EPS estimates are $36.98 billion and $5.27, versus the Street consensus of $40.26 billion and $6.02.

- Apple trades at 18.8x JPM's calendar 2009 EPS estimate, versus the peer group average of 11.1x. With macro pressures showing no signs of dissipating, they believe it is time to play defense, and they think Apple can avoid having a major problem with the "E" in the price-to-earnings multiple moving through the coming year. Firm expects the company's model to limit a series of major earnings cuts from unfolding in coming quarters, and they think this should support a valuation gap in Apple's favor.

Apple announced new aluminum shell, more powerful laptops on October 14, and reduced the price on updated laptops to under $1,000. Apple is poised to see a robust growth in its sale of notebooks during the holiday season owing to competitive pricing and better features.

Apple shares are down 48.6% year to date. Innovation Index Group has a BUY rating on Apple, and is now updating the 12 month price target in the range of $160 to $190.

IBM

JPMorgan upgrades IBM as a stock that is a 'sturdy ship' in rough economic waters

A JPMorgan analyst upgraded International Business Machines Corp. saying the company's diverse and steady revenue streams make the stock a "sturdy ship" in the worsening economic environment, the firm said Wednesday.

Mark Moskowitz raised his rating to "Overweight" from "Neutral" because IBM has diverse revenue sources that offer relative stability. He also said at least half of the company's revenue comes from annual payments on long-term services and software contracts.

IBM represents a "flight to quality" for investors" due to its broad services, hardware and software reach," the analyst wrote. IBM 3Q profits jumped 20% from last year in large part due to services contracts.

IBM shares are down 15.3% year to date. Innovation Index Group has a BUY recommendation on IBM with a 12 month price target of $125 to $150.

These four innovators present attractive buying opportunity at the current price points.

Innovation Index Reports

About The Innovation Index

The Innovation Index introduced in December 2006 is a weighted stock price index of the top 20 Innovators in North America.

The Innovation Index returned 66% in 2007 based on performance model, and would have returned 174% over the previous five years (2002-2006) based on historical model*. This assumes equal investment in each stock of The Innovation Index as of December 31, 2001. An average of $100 invested in The Innovation Index on December 31, 2001 returned $454 as of December 31, 2007. By comparison, $100 invested in S & P 500 returned 28% or $129, $100 invested in NASDAQ returned 34% or $136, and $100 invested in the Dow Jones Index returned 30% or $131 through December 31, 2007. The Innovation Index beats the S & P 500, NASDAQ and Dow Jones Index by more than seven times over the past six years.*

Alphabetical list of the Top 20 Innovators of The Innovation Index for 2008 and their stock ticker symbols:

3M Company - (NYSE: MMM)
Amazon.com, Inc. - (NASDAQ: AMZN)
America Movil - (NYSE: AMX)
Apple Inc. - (NASDAQ: AAPL)
AT&T Inc. - (NYSE: T)
Best Buy Co., Inc. - (NYSE: BBY)
Cisco Systems, Inc. - (NASDAQ: CSCO)
Costco Wholesale Corporation - (NASDAQ: COST)
eBay Inc. - (NASDAQ: EBAY)
General Electric Co. - (NYSE: GE)
Google Inc. - (NASDAQ: GOOG)
Hewlett-Packard Co. - (NYSE: HPQ)
Intel Corporation - (NASDAQ: INTC)
International Business Machines Corp. - (NYSE: IBM)
Merck & Co., Inc. - (NYSE: MRK)
McDonald's Corporation (NYSE: MCD)
Microsoft Corporation - (NASDAQ: MSFT)
NIKE, Inc. - (NYSE: NKE)
Research In Motion Limited - (NASDAQ: RIMM)
The Proctor & Gamble Company - (NYSE: PG)

The Innovation Index will analyze the positions and standings of the Top 20 Innovators at the end of each year. For 2008, there will be no further changes in The Innovation Index.

Disclaimer: The Innovation Index Group, Inc. invests in the stocks comprising The Innovation Index.
*Past Performance Does Not Guarantee Future Results

Monday, October 13, 2008

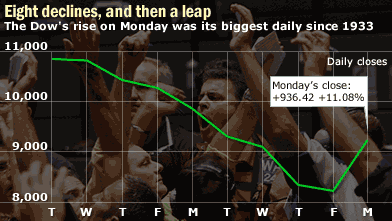
U.S. Stock Markets Make Historical Jump

Dow Jones gains 936.42 points in one day, the biggest single day jump, a rise of 11.08%. The S&P 500 climbs 104.10 points, or 11.6%, to 1,003.32, the S&P's largest daily point jump. The Nasdaq Composite amasses 194.74 points, or 11.8%, to 1,844.25, the third-greatest percentage rise.

The Innovation Index Fund gains 30% in one day, the largest percentage increase in one day.

What is in store for tomorrow? Can the markets continue this rally?

Our outlook is that the U.S. stock markets will rebound further post November elections and post November options expiration. Whether they would finish the year in the positive remains to be seen.

Innovation Index Reports

About The Innovation Index

The Innovation Index introduced in December 2006 is a weighted stock price index of the top 20 Innovators in North America.

The Innovation Index returned 66% in 2007 based on performance model, and would have returned 174% over the previous five years (2002-2006) based on historical model*. This assumes equal investment in each stock of The Innovation Index as of December 31, 2001. An average of $100 invested in The Innovation Index on December 31, 2001 returned $454 as of December 31, 2007. By comparison, $100 invested in S & P 500 returned 28% or $129, $100 invested in NASDAQ returned 34% or $136, and $100 invested in the Dow Jones Index returned 30% or $131 through December 31, 2007. The Innovation Index beats the S & P 500, NASDAQ and Dow Jones Index by more than seven times over the past six years.*

Alphabetical list of the Top 20 Innovators of The Innovation Index for 2008 and their stock ticker symbols:

3M Company - (NYSE: MMM)
Amazon.com, Inc. - (NASDAQ: AMZN)
America Movil - (NYSE: AMX)
Apple Inc. - (NASDAQ: AAPL)
AT&T Inc. - (NYSE: T)
Best Buy Co., Inc. - (NYSE: BBY)
Cisco Systems, Inc. - (NASDAQ: CSCO)
Costco Wholesale Corporation - (NASDAQ: COST)
eBay Inc. - (NASDAQ: EBAY)
General Electric Co. - (NYSE: GE)
Google Inc. - (NASDAQ: GOOG)
Hewlett-Packard Co. - (NYSE: HPQ)
Intel Corporation - (NASDAQ: INTC)
International Business Machines Corp. - (NYSE: IBM)
Merck & Co., Inc. - (NYSE: MRK)
McDonald's Corporation (NYSE: MCD)
Microsoft Corporation - (NASDAQ: MSFT)
NIKE, Inc. - (NYSE: NKE)
Research In Motion Limited - (NASDAQ: RIMM)
The Proctor & Gamble Company - (NYSE: PG)

The Innovation Index will analyze the positions and standings of the Top 20 Innovators at the end of each year. For 2008, there will be no further changes in The Innovation Index.

Disclaimer: The Innovation Index Group, Inc. invests in the stocks comprising The Innovation Index.
*Past Performance Does Not Guarantee Future Results

Sunday, October 12, 2008

Statement of IIG Financial Condition - Innovation Index Group

Dear Current and Prospective IIG Investors:

Some of you may have thought about the financial condition of IIG (Innovation Index Group) and my personal financial condition, especially in this current economic climate. Rest assured, I have worked hard for 10 years in Silicon Valley, and through the options in various company stocks that I worked at and that we gained, and smart investments in the stock markets and through the equity we built in our Fremont home that we sold last year, we have amassed enough savings to last us another five to ten years at the very least. We also bought a house this summer in Turtle Rock. We are blessed and lucky to be in this position. Having said that, it behooves us to work hard to continue this growth and not just deplete our savings, and to that end, I am planning to become a CFP next year and open a full-blown independent investment practice, and my wife has also begun working full-time. We have done well, and have no plans to retire in our forties... perhaps in our fifties ;-) And on a separate note, we are mentally healthy too, and plan to stay that way for the rest of our lives ;-) We do many things to relax and enjoy each weekend and during the week.

So, if you are considering investing in the stock market or real estate, please consider IIG - Innovation Index Group and REIG - Real Estate Investing Group (newly launched) as your consistent partner for steady growth over the next five to ten years and beyond. Invest with Confidence and Grow your Wealth...

I am thankful and grateful to my partners in IIG and REIG, and all our friends, family members, and partners for your continuous support and belief.

Sincere regards,
Sanjay Dalal
President & Managing Director
October 12, 2008

*Past performance does not guarantee future results. Refer to Innovation Index Fund and Real Estate Investing Group Prospectus for full details

Sunday, July 13, 2008

To Sell Or Not To Sell? You Decide.

If you are an investor in the stock market or real estate, are you considering selling your investments because of the current market conditions?

The major U.S. indices are down more than 20% from the recent peak set in October, 2007 - officially marking the return of the Bear market. Oil is more than $145 a barrel, and showing a real impact at the gas station when you take your car for a fill-up. Real estate prices are back to 2004 levels, or perhaps even 2003 or 2002. Foreclosures, Short sales, Auctions and Loan Defaults are accelerating, and going through the roof. Countrywide, the nation's largest home lender, was acquired by Bank of America earlier in the year; then it was Bear Sterns that had one last gasp, before getting a bail-out from JP Morgan and Federal Reserve; last Friday, IndyMac, one of the largest lenders in the nation and California, went bankrupt and closed doors. And there are rumors on whether Freddie and Fannie will survive through this mess. Oh my!

Your hard-earned money has perhaps lost 10%, 20%, 30% or even more than 50% owing to investments in the stock market or real estate.

What do you do?

Do you sell or hold on to your investments? Or do you double down?

This is perhaps the toughest question you would need to answer.

History shows that markets go through cycles of expansion, peak, contraction, consolidation, expansion, peak.... bull markets and bear markets. For instance, after the dot-com meltdown, we had an unprecedented boom that began in 2002 and lasted through 2007 - over five years. The bear market had lasted about two years prior to that. Whereas the last bear market had to do with the collapse from the dot-com euphoria and companies who lacked fundamentals, the current bear market is driven by larger macro-economic factors impacting the nation whole.

Fundamentally, except for the financial companies who had exposure to mortgages and sub-primes, most of the sectors are doing equal or better than they did in 2007. This is HUGE! However, Wall Street's business is driven by finance - and when the going was good, many Wall Street firms doubled up on the risky bets of the derivatives, sub-primes and mortgages. And they paid a dear price! The smart firms such as Goldman Sachs actually made money. Now some of the Wall Street firms want to save their face, and also make up for the huge losses. One way to do this is spread fear, talk the bear talk, get inside the investors' psyche, bet down the entire market - and make money as the markets go down. Someone has to panic as markets go down - the ones who panic the most are not the large Wall Street firms - instead, they are the individual investors who can't stomach the losses on their portfolio, and sell out while the chips are down. While the individual investors are selling at lowered prices, large hedge funds and institutions are making money.

So should you sell out now, or wait?

If you have invested in companies with great fundamentals, solid operations, sound management, and if these companies are still growing or holding steady in these tough economic times, you should have the strength of conviction and hold on to your investments. Just ask two questions - are they going to be around tomorrow, and are they going to be stronger than what they are today? Perhaps, you want to invest more if you believe in their future.

What are some of these top companies? GE, P&G, 3M, IBM, Apple, HP, Intel, J&J are just a few companies who have withstood economic and market downturns for the past decades. Newer bell-weathers include Cisco, Microsoft, McDonald's, Costco, Nike, Amazon.com, eBay, the new AT&T, RIM, Google and more.

An often repeated stock market mantra is to "sell in May and go away." One often forgotten fact is historically the market has performed differently - "better" - in presidential election years.

A recent chart by Chart of the Day details the performance of the Dow Jones Industrial Average in election years.


With the 2008 presidential campaign now in full swing, today's chart illustrates how the stock market has performed during the average election year. Whether the average election year is measured from 1980 or 1900, the market has tended to struggle during the first five months of an election year. That initial subpar performance was then followed with a rally (on average) right up to the November election. One theory to support this election year stock market behavior is that the first five months of choppiness is due in part to the uncertainty of the outcome of the presidential election (the market abhors uncertainty) with the market beginning to rally as the outcome of the election becomes increasingly evident.
If some of your other investments are making money, it may be a good idea to balance them with the ones that are losing money towards the end of the year.

To Sell or Not to Sell? You Decide.

About Innovation Index Group:

Innovation Index Group, Inc. is a new research company focused on systematically identifying, tracking, researching and reporting on the most innovative publicly traded companies in North America – collectively called the Innovation Index. Over the past six years, the Innovation Index would have generated a gross average annual return of 40% based on historical model.*

The Innovation Index Reports:
Introducing The Innovation Index - Learn about the Innovation Index
Innovation Index Group BUY Recommendations - 2008 BUY Recommendations and Estimates
Q1 2008 Report - Innovation Index ahead of S&P 500 - Q1, 2008 Report
The Innovation Index closes 2007 at 66% - 2007 Annual Report on the Innovation Index
Top 50 Innovative Companies in the world
- 2007 Report on Top 50 Innovative Companies
Annual Report - Chapter One - Total Innovation Activity
- 2006 Annual Report One
Annual Report - Chapter Two - The Top Innovator
- 2006 Annual Report Two
Annual Report - Chapter Three - The Innovation Insights
- 2006 Annual Report Insights
Innovation and Stock Performance Correlation
- The Innovation Index and Stock Performance
Future earnings guidance, A leading indicator - Earnings Guidance and Stock Price
Smart Investing In Tough Economic Times - Guide to Prudent, Value Investing

About The Innovation Index

The Innovation Index introduced in December 2006 is a weighted stock price index of the top 20 Innovators in North America.

The Innovation Index returned 66% in 2007 based on performance model, and would have returned 174% over the previous five years (2002-2006) based on historical model*. This assumes equal investment in each stock of The Innovation Index as of December 31, 2001. An average of $100 invested in The Innovation Index on December 31, 2001 returned $454 as of December 31, 2007. By comparison, $100 invested in S & P 500 returned 28% or $129, $100 invested in NASDAQ returned 34% or $136, and $100 invested in the Dow Jones Index returned 30% or $131 through December 31, 2007. The Innovation Index beats the S & P 500, NASDAQ and Dow Jones Index by more than seven times over the past six years.*

Alphabetical list of the Top 20 Innovators of The Innovation Index for 2008 and their stock ticker symbols:

3M Company - (NYSE: MMM)
Amazon.com, Inc. - (NASDAQ: AMZN)
America Movil - (NYSE: AMX)
Apple Inc. - (NASDAQ: AAPL)
AT&T Inc. - (NYSE: T)
Best Buy Co., Inc. - (NYSE: BBY)
Cisco Systems, Inc. - (NASDAQ: CSCO)
Costco Wholesale Corporation - (NASDAQ: COST)
eBay Inc. - (NASDAQ: EBAY)
General Electric Co. - (NYSE: GE)
Google Inc. - (NASDAQ: GOOG)
Hewlett-Packard Co. - (NYSE: HPQ)
Intel Corporation - (NASDAQ: INTC)
International Business Machines Corp. - (NYSE: IBM)
Merck & Co., Inc. - (NYSE: MRK)
McDonald's Corporation (NYSE: MCD)
Microsoft Corporation - (NASDAQ: MSFT)
NIKE, Inc. - (NYSE: NKE)
Research In Motion Limited - (NASDAQ: RIMM)
The Proctor & Gamble Company - (NYSE: PG)

The Innovation Index will analyze the positions and standings of the Top 20 Innovators at the end of each year. For 2008, there will be no further changes in The Innovation Index.

Disclaimer: The Innovation Index Group, Inc. invested in the stocks comprising The Innovation Index.
*Past Performance Does Not Guarantee Future Results

References:
Source: Sphere: Related Content David Templeton, CFA