How do you invest in the stock market during a recession, and still make money? Especially, when the economy is stalling, inflation keeps growing, oil prices sky-rocketing, unemployment rising, and housing market collapsing - how do you keep an even keel, and go about doing business as usual while your investment portfolio may be sinking 10% to 20%, or worse?
One answer: Smart Investing!Say you are buying a new car, new house, or a new business - what is the first question most people ask? How much does it cost? When it comes to
car buying though, it frequently becomes a highly emotional decision - the buyer is
not thinking of resale value, operating costs, and profits. Rather, how much fun would it be to drive this car, what would my friends say about it, and can I impress my girlfriend, boyfriend or someone special with it? Nowadays, another big question has entered the equation:
mileage. How many miles for a gallon of gas? How many times you ask yourself this question when buying a car: Can I make a profit from buying the car? Just go ask the buyers of hot hybrids who were able to buy them at retail, and are making a tidy profit from selling them.
What about
buying real estate? Either a primary home, secondary home, rental property, commercial or multi-unit? Again,
cost is still the number one question - the
down payment required to purchase the property. However, the home has to be
appealing and elevating (to your senses) - especially the primary home. How many times have you bought a home that looked downright ugly? Perhaps never. Unless you are an expert in turnarounds, and are buying a cheap unit, can make it look pretty, and make a profit from it. With real estate, besides the cost, "
affordability" becomes a real issue because most real-estate buys are in the hundreds of thousands, millions or even more.
Can I afford this piece of real-estate? Do I have enough money to make a down payment, and then enough to make a monthly mortgage? Would the bank approve the loan? If this is my primary home, can I live happily for the next umpteen years without having to worry about mortgage? Again, the question on whether I would make a profit from my primary home is secondary. If you are buying an investment property, profits and cash flow are quite important. How soon can I recoup my down payment is another question that investors of real estate properties always think about. And the ability to create a monthly income through positive cash flow is relevant. Finally, how long do I hold this property before I can sell it for a profit - the time value of my investment and the potential returns thereof.
What about
buying a business? Besides costs, profits, and cash flow, questions such as revenue, gross margins, operating costs, revenue growth, inventory, liabilities and debts enter into the equation. Now, one has to think about the management and people - who is running the show, and the ability to retain key talent after the acquisition. What about the products that the business sells, competition, customers, current market, and market opportunity? Is the market for this business growing or retreating? Is this business one of the top players, a second-rate player or a startup? What is the overall health of this business? What is the future outlook? All these questions must be answered before you buy a new business. And based on a thorough analysis, you make the decision to purchase - or not. Buying a business is perhaps the most important decision of anyone's professional career. If you make a good decision, you can profit from it; a bad decision, and you can lose all your capital. Your ability to manage and grow the business is also critical.
What does all this have to do with buying stocks and stock investing?Purchasing stocks of a company, mutual funds, ETFs, or any stock investment for that matter should be the hardest decision you ever make - even harder than buying a car, buying a house, or buying a business. But the reality is - well we all the know the reality of investing in the stock market. We get a hot tip from a friend, a recommendation from a broker, see a particular stock running up, get influenced by an investor newsletter, read an investor journal, watch Jim Cramer's Mad Money or another investment show on TV - and we buy the stocks of a particular company, and invest our hard earned money. And wait. And wait. And wait. Wait for the stock to run up. To go up by 10%, 20% or more. But it does not. It actually drops in value. Now what do you do? Either sell out, or buy some more. All along you have not taken the time to understand the business whose stocks you have bought. Instead, you are just focused on making money somehow. And now you are emotionally attached to the stocks you have purchased. So you buy more stock at lowered value. And wait again. And wait some more. And the stock goes down further. Has this happened to you? Ultimately, you sell the stock for a huge loss, or just hold on to it, and see it drop further and further. Finally, you stop looking. If you got lucky though, you do end up making some money the first time. But the luck does run out eventually.
Smart Investing In Tough Economic TimesWhen the going gets tough, the tough gets going. Wish that was true for the stock market. Here is a quote from Benjamin Graham, considered by many as the father of investing, that everyone must live by if you ever consider investing in the stock market:
"An investment operation is one which, upon thorough analysis, promises safety of principal and a satisfactory return. Operations not meeting these requirements are speculative" -
Benjamin Graham
Actually, what Graham says is true for any investment. You always want to make sure your invested capital, the principal, is safe - you want to minimize risk as much as you can. How do you do this? By doing a "thorough analysis" of the operation. And on top of that, you want to produce a healthy return from your investment that makes you happy. But Graham goes one step further by proclaiming that any investment that does not follow these two simple rules are speculative.
Warren Buffett, the most prolific investor of our times, and a student of Graham, has offered these simple tenets before purchasing a stock and investing in a particular business:
Business Tenets
- Is the business simple and understandable?
- Does the business have a consistent operating history?
- Does the business have favorable long-term prospects?
Management Tenets
- Is management rational?
- Is management candid with its shareholders?
- Does management resist the institutional imperative?
Financial Tenets
- What is the return on equity?
- What are the company's "owner earnings"?
- What are the profit margins?
- Has the company created at least one dollar of market value for every dollar retained?
Value Tenets
- What is the value of the company?
- Can it be purchased at a significant discount to its value?
(reference: The Warren Buffet Way)
Only after you get a satisfactory answer to each of the above questions should you consider investing into the stock of a particular company. Now you realize why investing into the stocks takes a lot of planning and research - the "thorough analysis" that Graham alluded to. For instance, under the Management Tenet, the question on whether "management resists the institutional imperative" has to do with management's focus: on the business, or managing the investors.
Innovation Index Group thoroughly analyzes the Top Innovators in North America, and only reports on those that show the highest potential for growth and minimize the risk to the principal.
Here is how Innovation Index Group determines the best companies:
Selection MethodologyThe Innovators in The Innovation Index are determined using intensive factual research and analysis, leveraging the following resources:
1. Rankings of world’s top innovative companies as published by BusinessWeek and Boston Consulting Group
2. Rankings of the top Innovators as published by Forbes, Fortune and other business publications
3. Analysis of revenue, earnings, cash flow and management performance
4. Assessment of the tangible value of the Innovators including their brand value
5. Historical analysis of launched innovations – products, acquisitions, pricing, distribution, business model, services, process – and their impact on current and future revenue and earnings growth
6. Analysis of planned market innovations and potential revenue growth
7. Independent analysis by S & P, Zack’s, Barron’s, IBD and related resources
8. Complete analysis of the Innovators’ customers, competitors, environment and macro-economic factors that could impact their growth and stock performance
9. Wherever possible, interviews with key members of the management
Investment Principles
1. Isolate top Innovators that have demonstrated a solid history of innovations, revenue and earnings growth.
2. Conduct a thorough analysis based on facts to determine the intrinsic value of each selected Innovator relative to its market.
3. Track and invest in top Innovators, so that investments can be made when their stock is available at a discounted price compared to intrinsic value so that a "margin of safety" exists.
4. Increase or decrease investment in a particular Innovator based on appreciation or depreciation in its stock performance, changes in current or projected earnings or revenue growth, changes in management or other market factors.
5. Liquidation of investment in a particular Innovator based on set triggers for performance gains or losses, or change in top Innovators at the end of each calendar year.
Innovation Index Group is grounded on the belief that Top Innovators who have demonstrated a solid history of innovations, revenue and earnings growth are most likely to produce the highest stock market returns in the future. These Innovators need not be the top company by market cap for a particular sector; rather they could very well be challengers or “disrupters” that have demonstrated a real market for their products or services, are growing faster than the rate of the market (at times creating new markets altogether) and possibly grabbing market share from other competitors.
Differentiating Principles
The following principles differentiate our hypothetical investment methodology from other fund and investment managers:
1. Model Investments are limited to the crème de la crème– the best Innovators in their respective markets and industries are chosen after a complete, factual analysis as described earlier.
2. The Top 20 Innovators must each have a market cap of at least $10 billion and annual revenue of $2 billion. Thus, investments are limited to those Innovators who have grown into companies with a significant market capitalization and have demonstrated a superior history of revenue and earnings growth.
3. Model Investments for each Innovator are weighted based on the each Innovator’s launched innovations in the previous year, announced innovations for the upcoming year, market capitalization, earnings growth, revenue growth, projected earnings and revenue growth, analyst recommendations, historical and projected stock performance, current stock price, market fluctuations and its impact on the current stock price, “margin of safety,” and other micro and macro economic factors that could impact the growth of the innovator in the coming year.
4. A set percent of the available capital is set aside for short-term investments in the Innovators.
5. Model Investments are limited to the top 20 Innovators, because we believe on focusing on a select group of companies with the most growth potential.
Inflation needs to be stalled, and then reversed. Recession may last another couple of quarters or more, or may show modest turnaround within the next year. Housing industry may take the longest to recover. The Fed and the government are busy trying to help in all these areas by increasing liquidity in the financial markets, lowering the interest rates, providing rebate checks to consumers and families, and also beginning the work towards strengthening the dollar. The sooner these three elements improve for the American consumer, the better the chances of an economic rebound in the fourth quarter of 2008, and a resulting growth in the stock market.
Innovation Index Group believes that the U.S. economy will recover in the 2nd half of 2008, and the Top Innovators of The Innovation Index will reward the patient, long-term investor. So far, most of the top innovators have delivered solid earnings during the first quarter of 2008 owing to the strengths and growth in their global business, new innovations spurring new business growth, maintenance of US earnings, and benefits from the currency fluctuations. It would be great to witness a spiraling growth of their US earnings in the 2nd half 2008.
Innovation Index Group has long-term BUY recommendations on the Top 20 Innovators of The Innovation Index.About
Innovation Index Group:
Innovation Index Group, Inc. is a new research & management company focused on systematically identifying, tracking, researching and reporting on the most innovative publicly traded companies in North America – collectively called the
Innovation Index. Over the past six years, the Innovation Index
would have generated a gross average annual return of 40% based on historical model.* The Innovation Index returned 66% in 2007*.
The Innovation Index Reports:
Learn about The Innovation Index - Innovation Index Fund tracks The Innovation Index
The Innovation Index closes 2007 at 66% - 2007 Annual Report on the Innovation Index
Top 50 Innovative Companies in the world - 2007 Report on Top 50 Innovative Companies
Annual Report - Chapter One - Total Innovation Activity - 2006 Annual Report One
Annual Report - Chapter Two - The Top Innovator - 2006 Annual Report Two
Annual Report - Chapter Three - The Innovation Insights - 2006 Annual Report Insights
Innovation and Stock Performance Correlation - The Innovation Index and Stock Performance
About The Innovation Index
The Innovation Index introduced in December 2006 is a weighted stock price index of the top 20 Innovators in North America.
The Innovation Index returned 66% in 2007 based on performance model, and would have returned 174% over the previous five years (2002-2006) based on historical model*. This assumes equal investment in each stock of The Innovation Index as of December 31, 2001. An average of $100 invested in The Innovation Index on December 31, 2001 returned $454 as of December 31, 2007. By comparison, $100 invested in S & P 500 returned 28% or $129, $100 invested in NASDAQ returned 34% or $136, and $100 invested in the Dow Jones Index returned 30% or $131 through December 31, 2007. The Innovation Index beats the S & P 500, NASDAQ and Dow Jones Index by more than seven times over the past six years.*
Alphabetical list of the Top 20 Innovators of The Innovation Index for 2008 and their stock ticker symbols:
3M Company - (NYSE: MMM)
Amazon.com, Inc. - (NASDAQ: AMZN)
America Movil - (NYSE: AMX)
Apple Inc. - (NASDAQ: AAPL)
AT&T Inc. - (NYSE: T)
Best Buy Co., Inc. - (NYSE: BBY)
Cisco Systems, Inc. - (NASDAQ: CSCO)
Costco Wholesale Corporation - (NASDAQ: COST)
eBay Inc. - (NASDAQ: EBAY)
General Electric Co. - (NYSE: GE)
Google Inc. - (NASDAQ: GOOG)
Hewlett-Packard Co. - (NYSE: HPQ)
Intel Corporation - (NASDAQ: INTC)
International Business Machines Corp. - (NYSE: IBM)
Merck & Co., Inc. - (NYSE: MRK)
McDonald's Corporation (NYSE: MCD)
Microsoft Corporation - (NASDAQ: MSFT)
NIKE, Inc. - (NYSE: NKE)
Research In Motion Limited - (NASDAQ: RIMM)
The Proctor & Gamble Company - (NYSE: PG)
The Innovation Index will analyze the positions and standings of the Top 20 Innovators at the end of each year. For 2008, there will be no further changes in The Innovation Index.
Disclaimer: The Innovation Index Group, Inc. invests in the stocks comprising The Innovation Index.
*Past Performance Does Not Guarantee Future Results
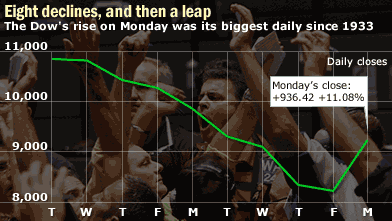 Dow Jones gains 936.42 points in one day, the biggest single day jump, a rise of 11.08%. The S&P 500 climbs 104.10 points, or 11.6%, to 1,003.32, the S&P's largest daily point jump. The Nasdaq Composite amasses 194.74 points, or 11.8%, to 1,844.25, the third-greatest percentage rise.